Author: Anna

  • Yttrium: properties, uses, and supply chain: Latest Developments and Analysis

    Yttrium: properties, uses, and supply chain: Latest Developments and Analysis

    **Yttrium’s 2024‑2025 risk profile is driven less by geological scarcity than by the split between oxide‑dominated high‑volume uses and tightly constrained metal production. This analysis maps the physical properties, processing routes, and global supply nodes that define those constraints, clarifying where technical specifications, ESG regulation, and geopolitical controls combine to create operational bottlenecks across electronics, energy, aerospace, and medical value chains.**

    Yttrium Metal vs Oxide in 2024‑2025: Fast Technical Reference for Sourcing and Operations

    Executive context. Yttrium (Y, atomic number 39) occupies an unusual position in the rare earths system: the oxide (Y₂O₃) underpins high‑volume applications in electronics, energy ceramics, and optics, while the metal serves much smaller but highly sensitive roles in aerospace and defense alloys. Physically and logistically, these are almost two different commodities. The oxide is a stable white powder moving in bulk; the metal is a reactive, sometimes pyrophoric solid that demands inert handling and specialised freight. That divergence shapes everything from process design to export‑control exposure.

    Publicly available technical notes and industry commentary indicate that most yttrium demand in 2024‑2025 flows through oxide into phosphors, ceramic electrolytes, and laser hosts, while metal tonnage remains comparatively small but mission‑critical for turbine components, specialty welding, and some defense‑grade superalloys.[1-7] The industrial question is no longer simply “is yttrium available,” but rather: which form, at what purity, with which processing and compliance path, and under what geopolitical and ESG constraints.

    The sections below anchor that assessment on four pillars: the metal-oxide property split, the process routes that transform ore into usable forms, the application clusters that lock in demand, and the specific bottlenecks that now dominate supply chain risk.

    1. Fundamental Properties: Why Metal and Oxide Behave Like Different Commodities

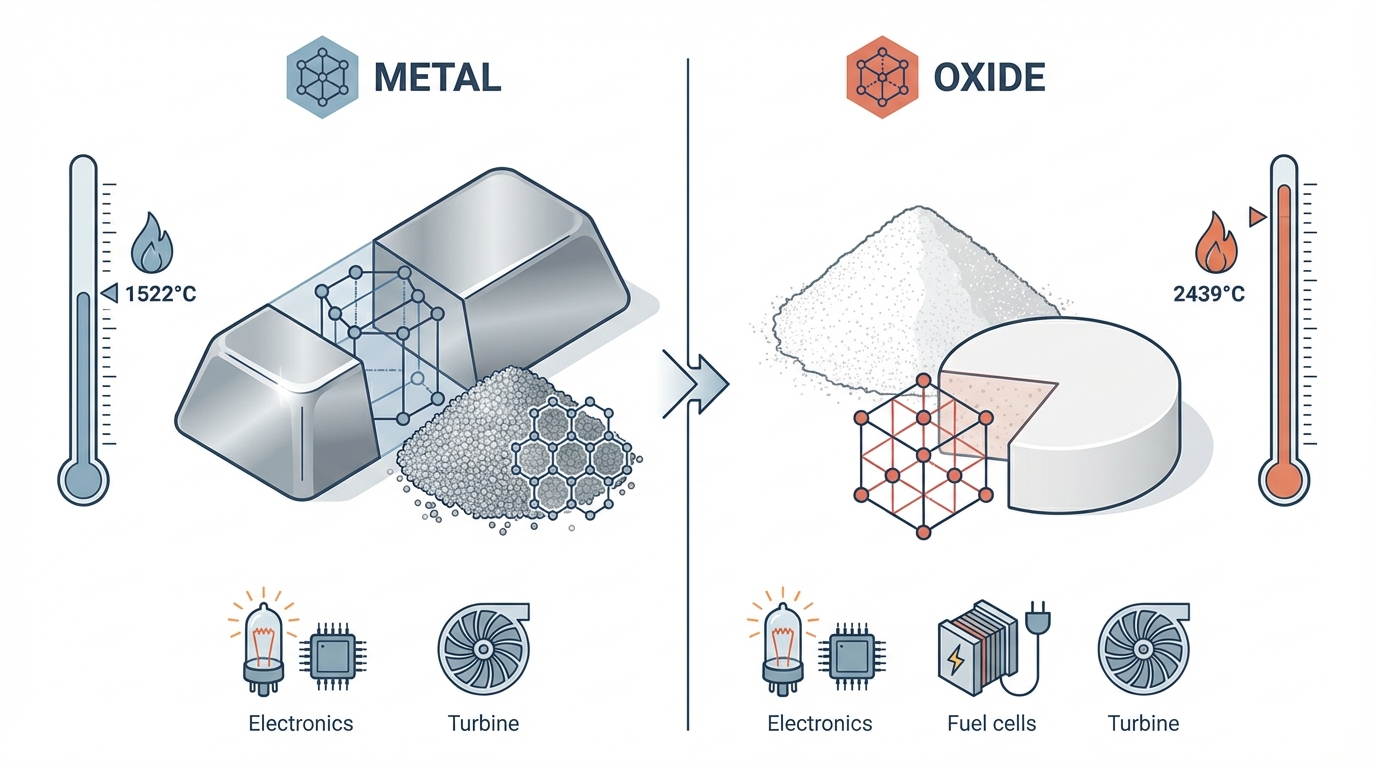
    1.1 Yttrium metal: reactive, ductile, and logistics‑sensitive

    Yttrium metal is a silvery transition metal with a hexagonal close‑packed crystal structure at room temperature and a density of about 4.47 g/cm³.[2,4] Its melting point near 1526°C and boiling point around 3336°C support use in high‑temperature environments, particularly as a microalloying element in nickel, magnesium, and aluminium systems where creep resistance and oxidation behaviour matter.

    In air, yttrium rapidly forms a thin protective oxide film. That passivation is beneficial for component lifetimes but comes with a critical caveat: fine metal powders and turnings can become pyrophoric. Industry datasheets report a risk of spontaneous ignition of metal fines above roughly 400°C in air, which has pushed standard practice toward storage in inert atmospheres (argon) and vacuum‑sealed packaging for higher‑surface‑area forms.[2,6] For bulk logistics, that translates into hazardous‑material classification, segregated storage, and in many cases a bias toward specialist carriers rather than generic bulk freight.

    From a processing perspective, the metal’s main handicap is its reactivity. Producing high‑purity (>99.9% or 99.99% by mass) yttrium metal typically requires high‑temperature reduction and molten‑salt electrolysis, both of which carry non‑trivial energy intensity and limited batch sizes, particularly when purity specifications include sub‑10‑ppm thresholds for transition metal contaminants in advanced alloys or superconducting applications.

    1.2 Yttrium oxide (Y₂O₃): ceramic workhorse for electronics and energy

    In contrast, yttrium oxide (Y₂O₃) is a chemically stable, white ceramic powder with a cubic crystal structure, a melting point around 2425°C, and a relatively high refractive index in the 1.9-2.1 range.[1,5] It is robust against moisture and oxygen, does not ignite, and can be shipped as a standard industrial chemical in bulk bags or drums. Its optical and dielectric properties, as well as its ability to form solid solutions with zirconia and other oxides, underpin its dominant role in:

    • phosphors for LEDs and displays (typically Y₂O₃ doped with rare earth activators such as europium),
    • yttria‑stabilized zirconia (YSZ) electrolytes and coatings,
    • laser host materials and transparent ceramics, and
    • high‑performance refractories and crucibles.

    Oxide powders can be processed by conventional ceramic routes-spray drying, pressing, and sintering around 1000–1200°C-or incorporated as dopants into alumina, zirconia, and garnet structures. Because of this process familiarity, most industrial demand is specified directly in oxide form, with purity grades such as 99.5% (for general ceramics and phosphors) or 99.9% (for optics and electronics) that are accessible at industrial scale.

    1.3 Property comparison and immediate supply implications

    Property Yttrium Metal Yttrium Oxide (Y₂O₃) Supply Chain Implication
    Physical form Ingot, rod, granules, powder (reactive) Stable white powder Oxide suitable for bulk shipping; metal often handled as hazmat
    Density ≈ 4.47 g/cm³ ≈ 5.0 g/cm³ Oxide denser; influences volumetric loading in phosphors and ceramics
    Melting point ≈ 1526°C ≈ 2425°C Oxide suited to ultra‑high‑temperature ceramics; metal to high‑T alloys
    Reactivity Passivates, but powders can be pyrophoric Non‑flammable, chemically robust Metal requires inert storage; oxide fits conventional warehouse regimes
    Typical purity specs >99.9–99.99% for advanced alloys, superconductors ≈99.5%+ for phosphors and ceramics Metal production effectively batch‑limited; oxide can be produced continuously
    Relative cost level (2024 industry commentary) Several times higher per kg than oxide Baseline cost reference Metal pricing dominated by processing and compliance overhead

    Industry briefs frequently characterise yttrium as “oxide‑first”: for most high‑volume applications, material flows as Y₂O₃, not as metal.[1,3,5] Metal production is reserved for cases where yttrium must be incorporated into metallic matrices (superalloys, aluminium/magnesium alloys, or specialty solders), or where direct electrochemical reduction is integral to a process. This bifurcation is the first structural element of yttrium’s risk profile.

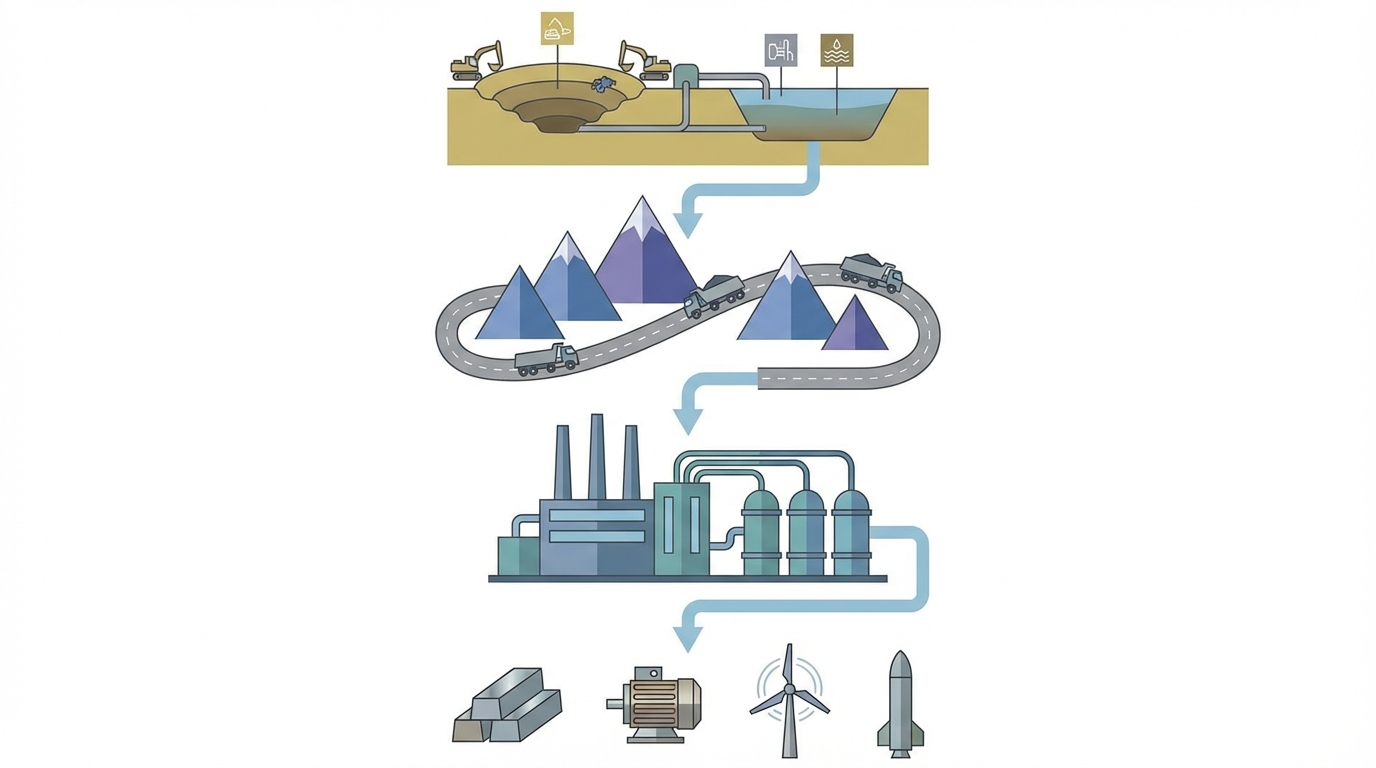
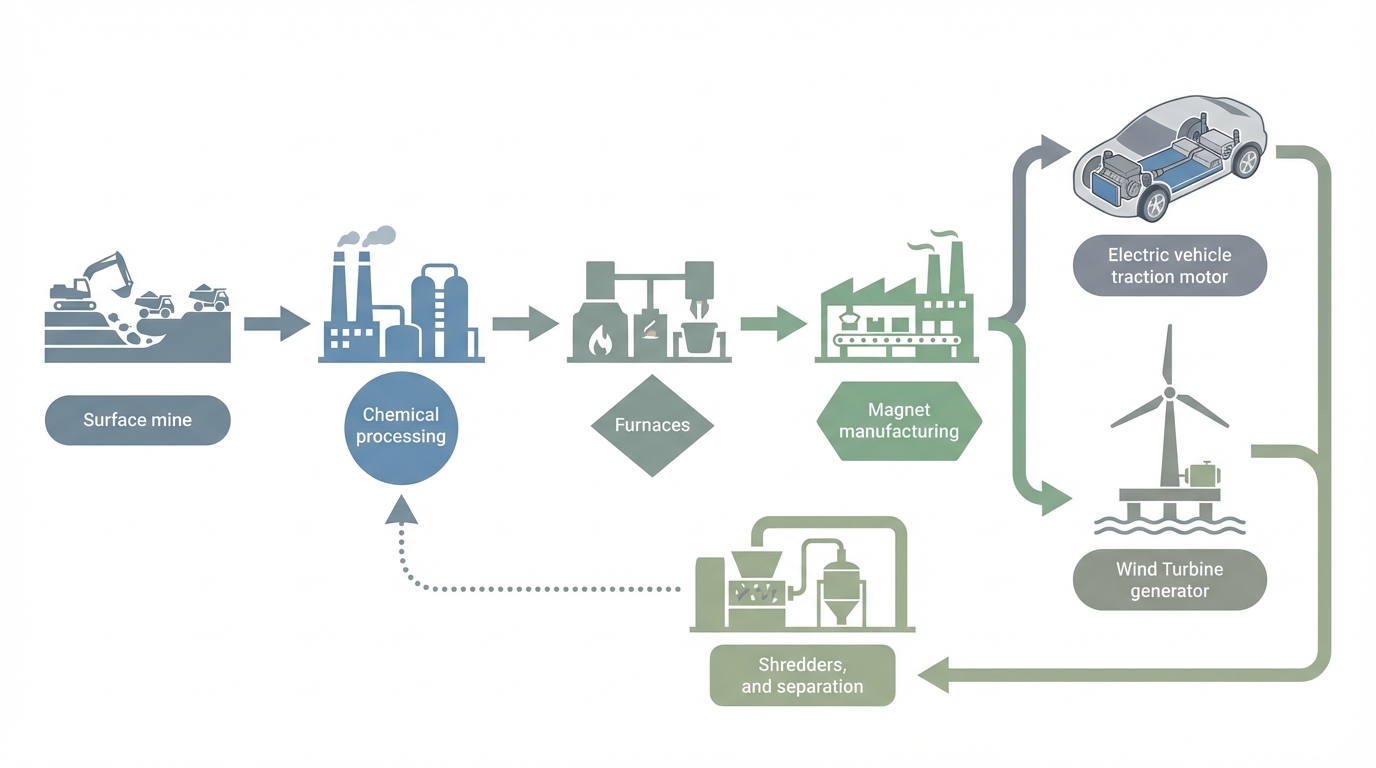
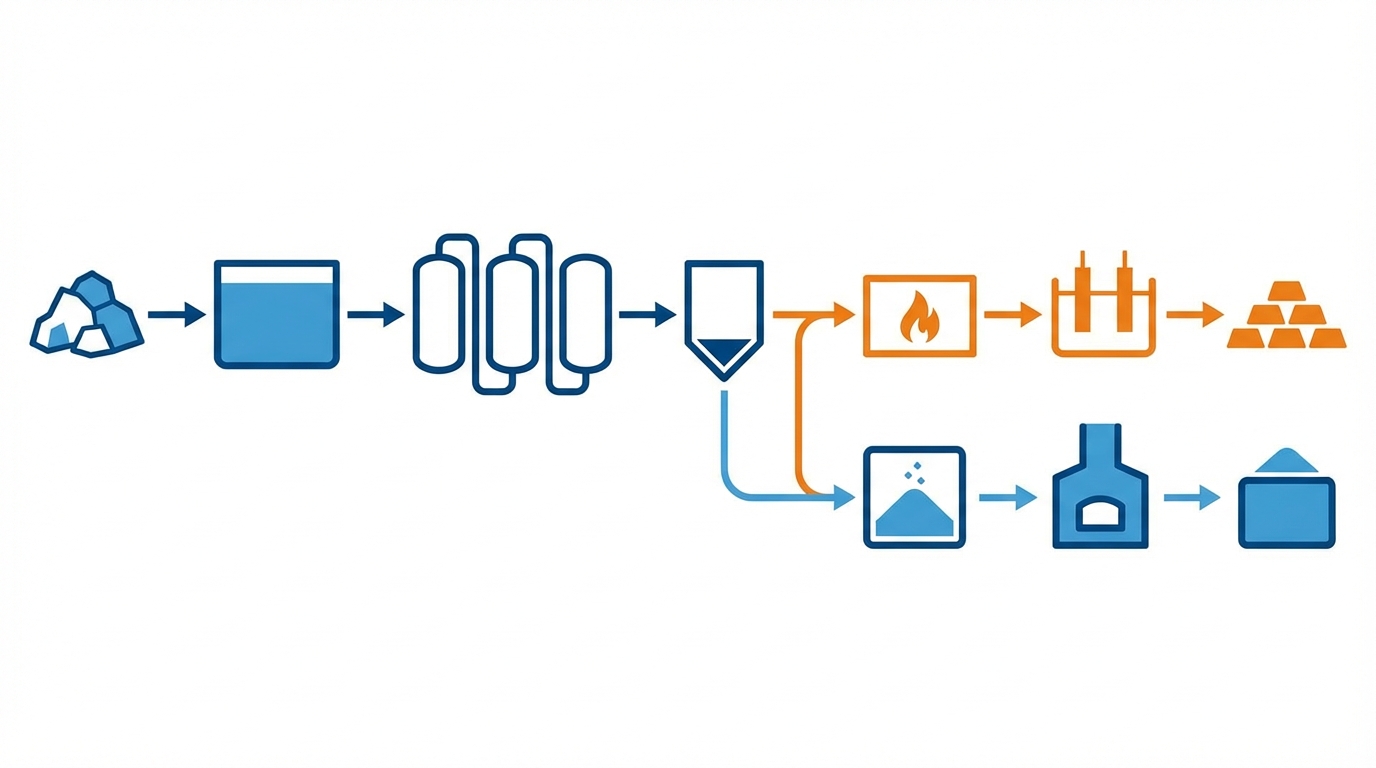
    2. Process Routes: From Ore to Oxide to Metal

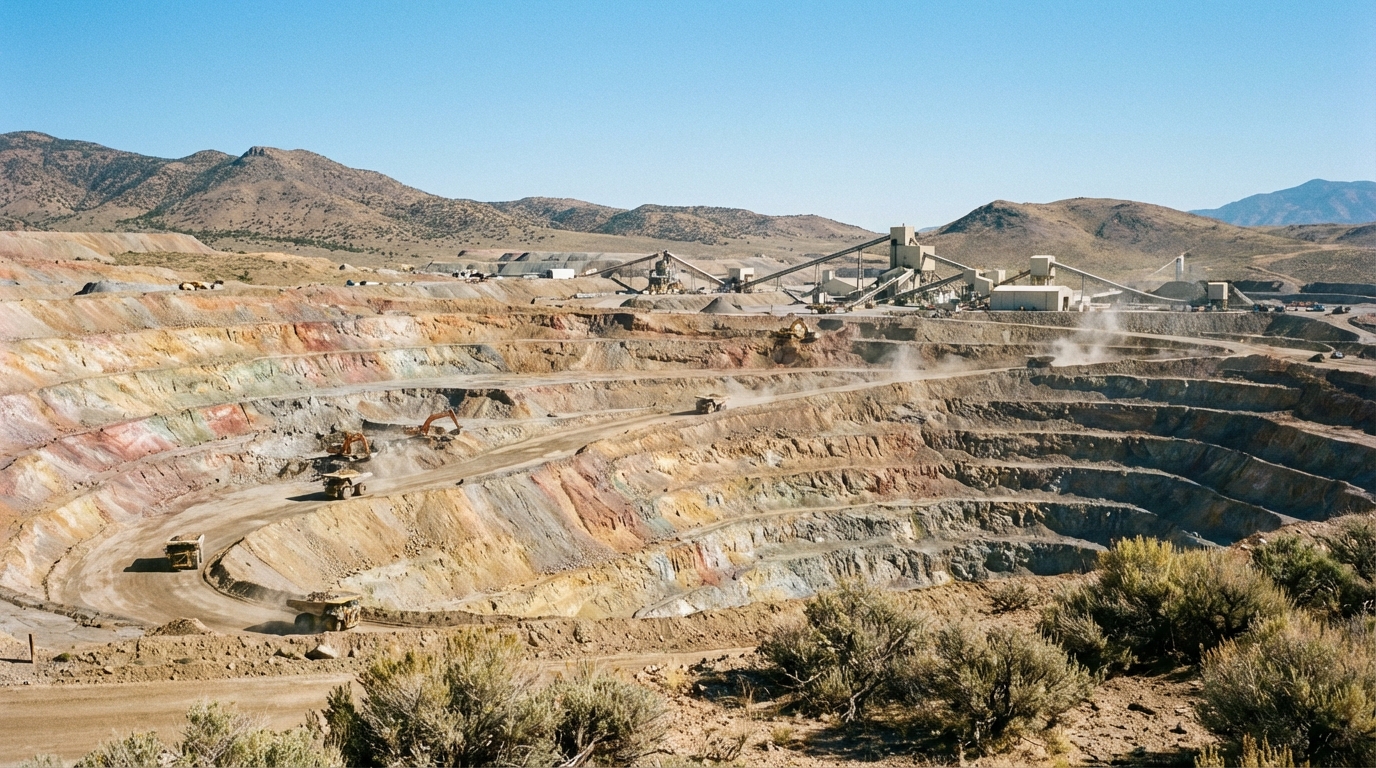
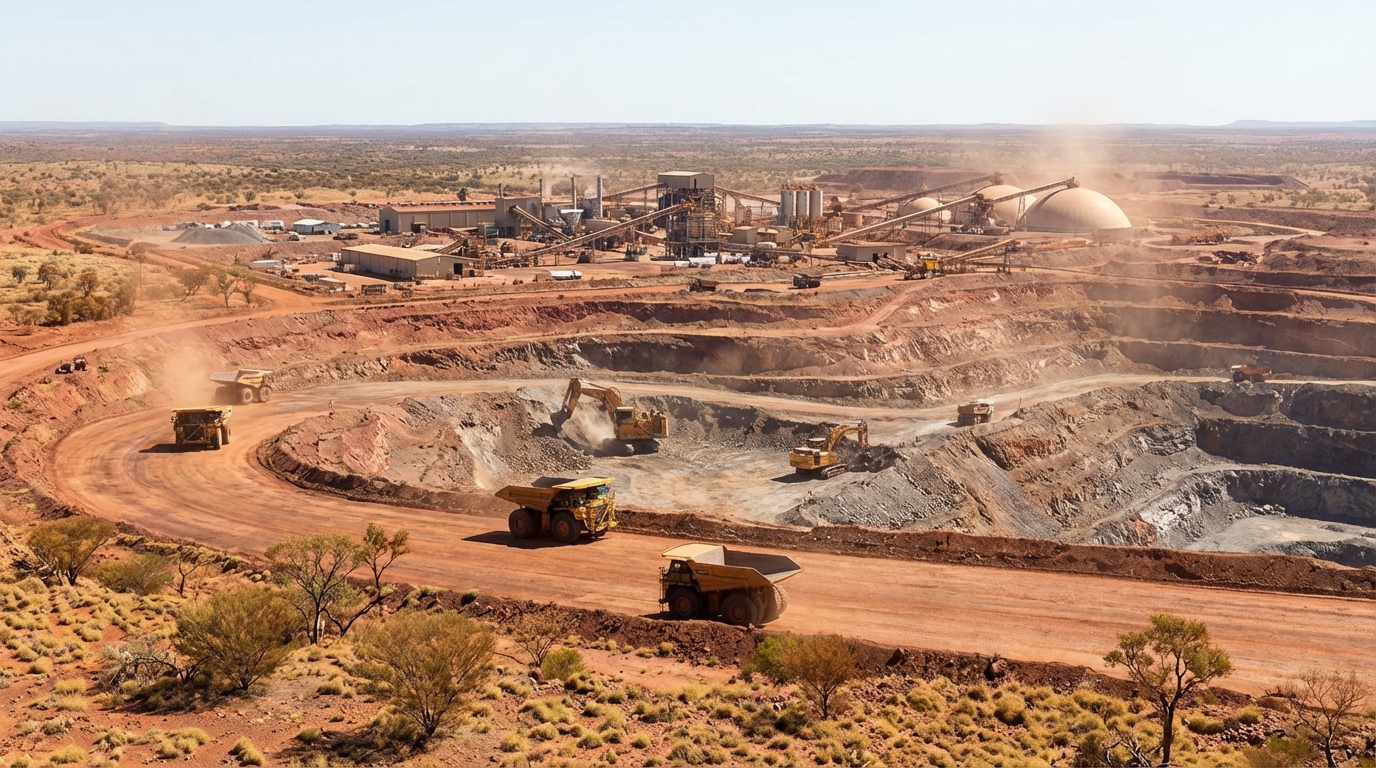
    2.1 Upstream: ores, clays, and mixed rare earth streams

    Yttrium rarely occurs in isolation. It is typically recovered as part of a mixed rare earth element (REE) stream from:

    • Bastnäsite and monazite ores, where yttrium is associated with light and some heavy rare earths, often at grades on the order of fractions of a percent to a few percent TREO (Total Rare Earth Oxides).
    • Ionic adsorption clays in southern China and parts of Southeast Asia, where yttrium and heavy rare earths are loosely bound to clay surfaces and can be leached with weak acid solutions.[2,7]

    In both cases, the mining and beneficiation steps-crushing, grinding, and flotation—are optimised to generate a mixed REO concentrate rather than a yttrium‑rich stream per se. Typical flowsheets target a rare‑earth oxide concentrate with elevated heavy‑REE content, which only later becomes a yttrium fraction through solvent extraction and precipitation. That shared upstream means yttrium volumes are tightly coupled to broader REE mining decisions and to demand for co‑products such as neodymium, dysprosium, and terbium.

    2.2 Midstream: chemical separation and oxide refining

    Once in solution—typically after sulphuric or hydrochloric acid leaching—the mixed rare earth stream enters large‑scale solvent extraction (SX) circuits. For yttrium, extractants such as phosphoric or phosphonic acids (e.g., P507) in organic diluents are arranged in long counter‑current banks, often comprising hundreds of mixer‑settler stages, to gradually separate light and heavy REEs and then individual elements.[2,6]

    Yttrium frequently tracks with heavier rare earths; the point in the SX train where a reasonably pure yttrium stream is available depends on feed composition and process tuning. Downstream, yttrium is precipitated (often as an oxalate), filtered, and calcined to Y₂O₃ at 1000–1200°C. This route yields oxide purities in the 99–99.9% range with recoveries that industry literature often describes as “in the 90%+ band” for well‑run circuits, but at the cost of significant reagent consumption and energy use.[2,8]

    The key industrial reality: SX banks are capital‑intensive, complex to operate, and highly tuned to specific feed blends. Retuning a circuit to change the relative output of yttrium versus other REEs is not instantaneous; it means extended campaigns, intermediate recycles, and often modifications to stripping and precipitation sections. That inertia underpins the lag between price signals and changed oxide availability.

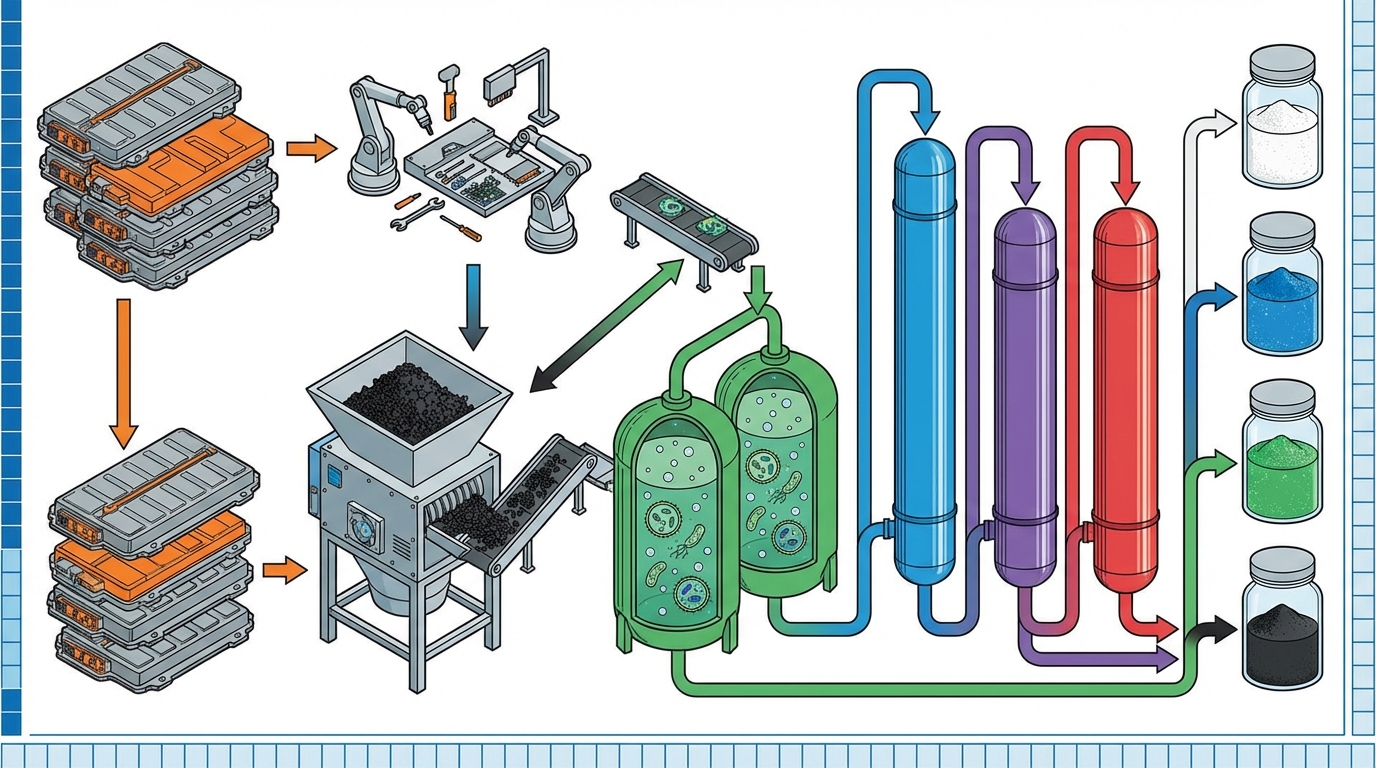
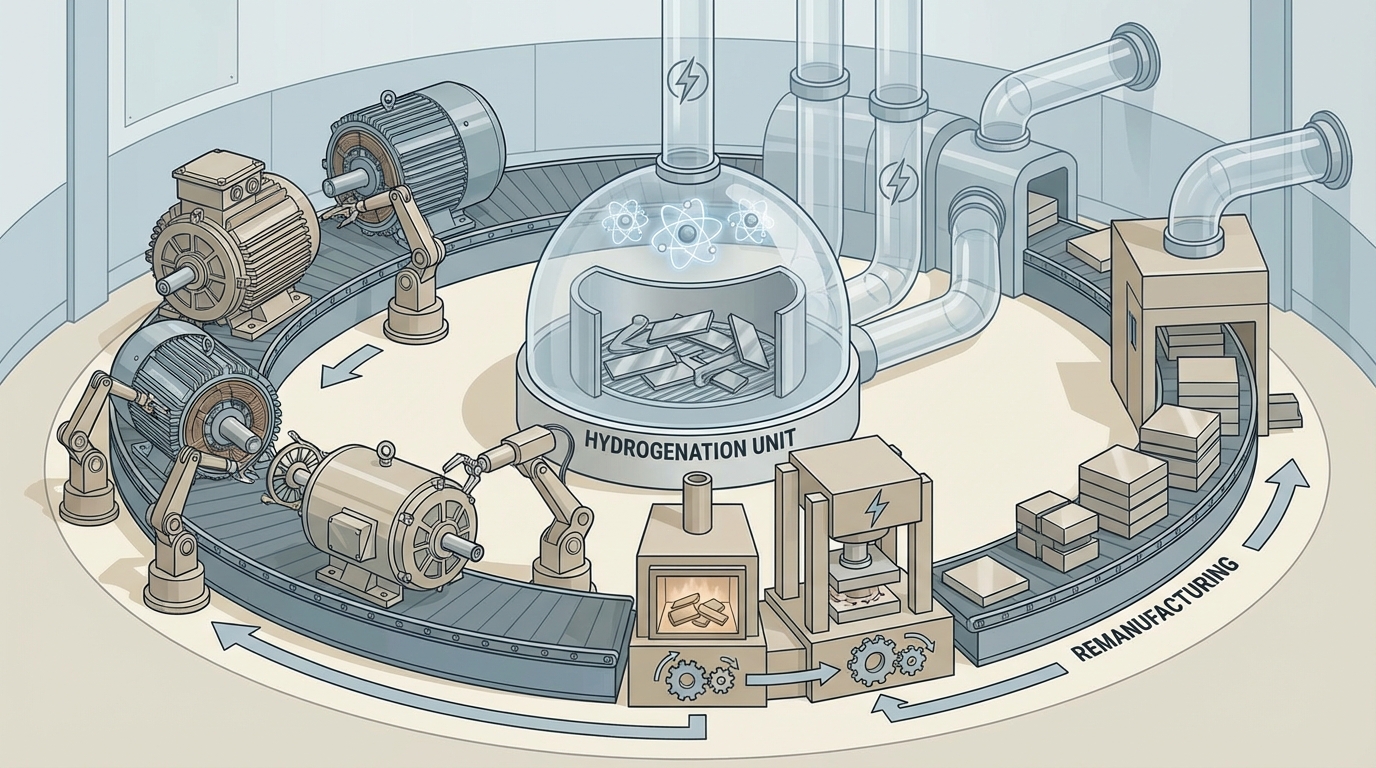
    2.3 Downstream: oxide‑to‑metal conversion and its constraints

    Transforming Y₂O₃ into metallic yttrium usually follows a two‑stage route:

    • Calciothermic reduction: Y₂O₃ is mixed with calcium and sometimes other additives, then heated at elevated temperatures. The simplified reaction Y₂O₃ + 3Ca → 2Y + 3CaO captures the basic chemistry.[2] Industrial practice must manage side reactions, control oxygen activity, and handle the resulting CaO‑rich slag. Reported metal purities from this stage generally fall below the final specifications for aerospace or superconducting uses, necessitating further refining.
    • Molten‑salt electrolysis: Yttrium chloride salts (often YCl₃ in a LiCl or similar melt) are electrolysed at temperatures around 800°C in inert atmospheres.[6] Electrolytic cells are typically operated in batches—commonly cited in the tens of kilograms scale—constrained by anode/cathode degradation, contamination control, and energy management.

    Each step introduces yield losses and waste streams (for example, calcium‑rich slag and spent salts) that attract ESG scrutiny and disposal costs. Industry commentary frequently notes that oxide‑to‑metal conversion has significantly higher specific energy consumption than oxide production itself and that effective recoveries after trimming to tight purity specs are noticeably lower than headline chemical yields.

    Visual comparison of yttrium metal and yttrium oxide properties and applications.
    Visual comparison of yttrium metal and yttrium oxide properties and applications.

    This combination—batch electrolysis, tight impurity limits, and hazardous‑material handling—explains why the global yttrium metal market remains measured in hundreds of tonnes per year, while oxide moves in the tens of thousands of tonnes. The bottleneck is technological and regulatory, not geologic.

    3. Application Clusters and How They Lock in Form Requirements

    Yttrium demand in the literature is often segmented into four broad clusters: electronics and displays, energy systems, aerospace and defense, and optics/medical uses.[1,3,5,7] Each cluster is anchored in either oxide or metal form, with different purity and microstructural constraints, which in turn determine exposure to specific parts of the supply chain.

    3.1 Electronics and displays: phosphors and dielectric ceramics

    In displays and solid‑state lighting, yttrium almost exclusively enters as oxide. The classic example is Y₂O₃:Eu red phosphors, where Y₂O₃ is doped with europium to convert UV or blue excitation into red emission for LED packages and flat‑panel displays.[1,5] These formulations demand tight control of particle size, dopant distribution, and impurity levels (notably transition metals that can quench luminescence).

    Because performance is highly sensitive to trace contaminants, phosphor producers commonly specify oxide in the 99.5–99.9% purity range with narrow limits on iron, nickel, and other coloured ions. Once production lines are tuned around a specific powder morphology and purity profile, switching suppliers or feed origins involves non‑trivial requalification and potentially full re‑binning of LED performance grades. That process rigidity is one reason display‑grade Y₂O₃ frequently carries a premium over more generic ceramic grades.

    Beyond phosphors, yttrium‑containing dielectric ceramics appear in capacitors and substrates where a balance between permittivity, breakdown strength, and thermal stability is required. Again, these are oxide‑centric uses; metallic yttrium plays no direct role at the component level.

    3.2 Energy systems: YBCO superconductors and YSZ fuel cells

    Energy applications highlight yttrium’s role in advanced functional materials:

    • High‑temperature superconductors such as YBa₂Cu₃O₇₋ₓ (YBCO) rely on yttrium at the A‑site of the perovskite‑like lattice. Here, Y₂O₃ is consumed as a precursor in powder synthesis and thin‑film deposition. Critical current performance at liquid‑nitrogen temperatures (~77 K) is sensitive to stoichiometry and impurity levels, prompting demands for high purity and controlled oxygen content.[2,5]
    • Yttria‑stabilised zirconia (YSZ) for solid oxide fuel cells (SOFCs) and gas turbine components typically contains around 8–10 mol% Y₂O₃ in zirconia. This stabilises the cubic or tetragonal phase and enables high oxide‑ion conductivity at operating temperatures often cited in the several‑hundred‑to‑around‑800°C range.[5,6]

    For SOFCs, the electrolyte and interconnect materials are among the highest value‑add uses of yttrium oxide by mass. Public energy roadmaps in Europe and Asia describe aggressive deployment targets for fuel cells in power and industrial applications, implying sustained demand for Y₂O₃‑bearing ceramic powders and coatings. YSZ production is oxide‑intensive; conversion to metal is irrelevant here and would simply add cost and energy consumption.

    Electrodes and interconnects in some fuel cell and hydrogen technologies may integrate Ni‑Y or other yttrium‑enriched alloys, where the metal form re‑enters the picture. In those cases, traceability of metal feed and compliance with dual‑use regulations (in particular when alloys overlap with defense specifications) become part of the operational picture.

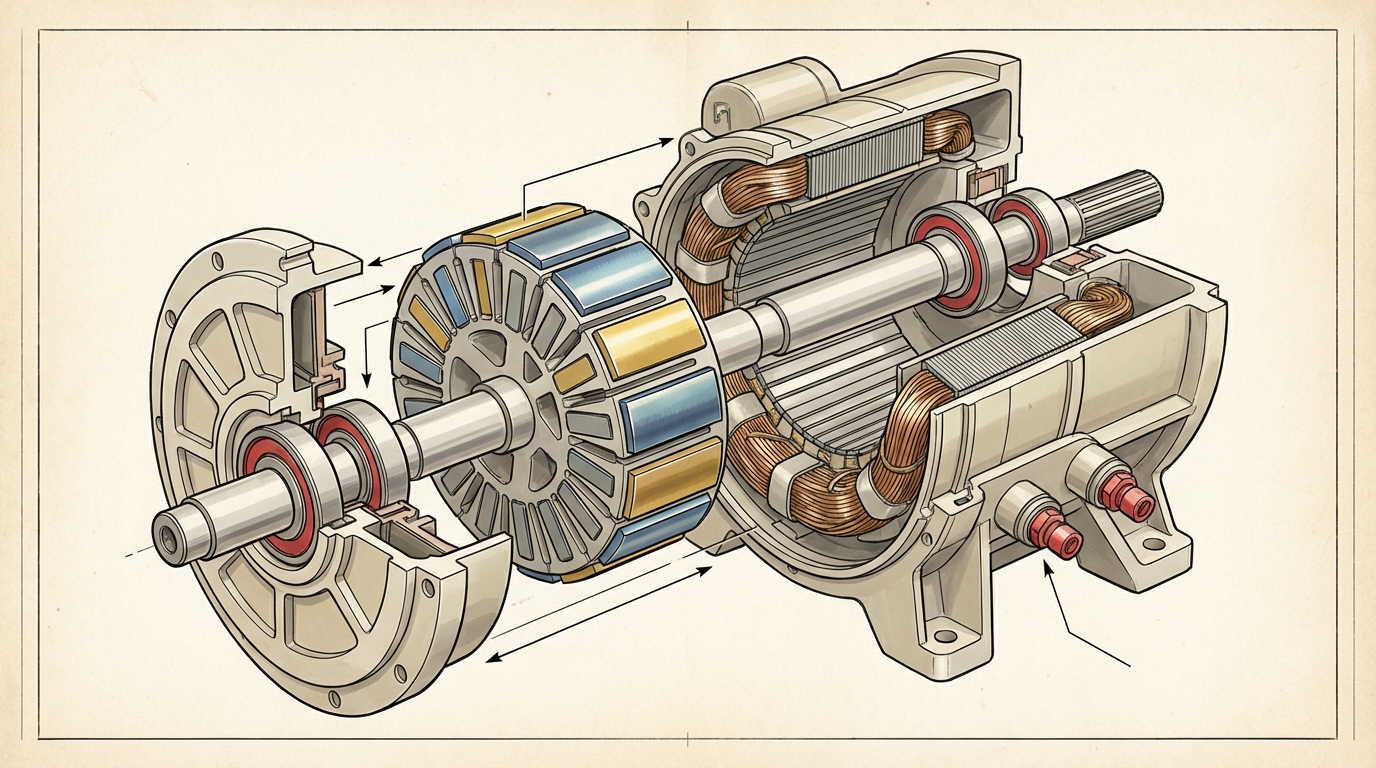
    3.3 Aerospace and defense: small tonnages, high strategic sensitivity

    Aerospace and defense applications concentrate much of the strategic attention on yttrium, despite relatively modest tonnage. Two families dominate:

    • Microalloyed metals. Small additions of yttrium (often on the order of 0.1–1% by weight) to nickel‑based superalloys, aluminium, or magnesium can improve high‑temperature creep resistance, grain boundary cohesion, and oxide scale adherence.[3,4] These improvements are particularly relevant for turbine blades, combustor components, and structural alloys in high‑heat zones.
    • Thermal barrier and environmental coatings. Yttrium oxide is a key dopant in some zirconia‑based thermal barrier coatings (TBCs) applied by plasma spraying or electron‑beam physical vapor deposition (EB‑PVD). These coatings slow thermal degradation of turbine parts and can extend service intervals materially when engineered correctly.[3]

    Defense procurement documents cited in industry analyses describe yttrium metal purity specs at or above 99.9% for certain jet engine and airframe components, with additional restrictions on trace elements that affect fatigue and oxidation behaviour. This narrows the supplier pool to a small set of qualified refiners capable of delivering consistent analysis (often verified by techniques such as glow‑discharge mass spectrometry, GDMS). Export controls (e.g., ITAR/EAR in the United States) can apply not only to finished alloys but also, in some cases, to specific high‑purity input streams.

    The result is a two‑tier system: commodity‑like oxide supply for generic ceramics and phosphors, and a much more tightly controlled metal and high‑purity oxide channel for aerospace and defense. Disruptions to the latter may not show up easily in aggregate REE statistics but can halt specific engine or system programs.

    Global yttrium supply chain map showing primary mining and refining hubs.
    Global yttrium supply chain map showing primary mining and refining hubs.

    3.4 Optics, lasers, and medical use

    Optical and medical uses add a further layer of specificity to yttrium demand:

    • Laser hosts. Yttrium aluminium garnet (YAG, Y₃Al₅O₁₂) and related structures form the backbone of many industrial lasers. Here, Y₂O₃ is consumed into high‑purity alumina‑yttria mixtures that are melted and grown into single crystals, often by the Czochralski process, over multi‑day cycles.[2,4] Defect rates on the order of fractions of a percent can already impact yields for high‑power laser rods, putting a premium on powder cleanliness and process control.
    • Transparent ceramics. Fully dense polycrystalline Y₂O₃ or YAG can serve as infrared windows and laser hosts when porosity and grain size are tightly managed. This segment is extremely sensitive to powder morphology, sintering aids, and contamination.
    • Medical isotopes. Radioisotopes such as yttrium‑90 are used in radiotherapy; while the source chemistry may involve oxides or salts, the volumes are small compared with industrial ceramics but demand very high radiochemical purity and controlled decay logistics.[4,7]

    In these domains, yttrium is typically locked into long‑term qualification chains: once a laser platform or radiopharmaceutical process is validated with a specific yttrium chemistry and supplier, substitution requires fresh regulatory and technical validation. That significantly reduces short‑term elasticity of demand.

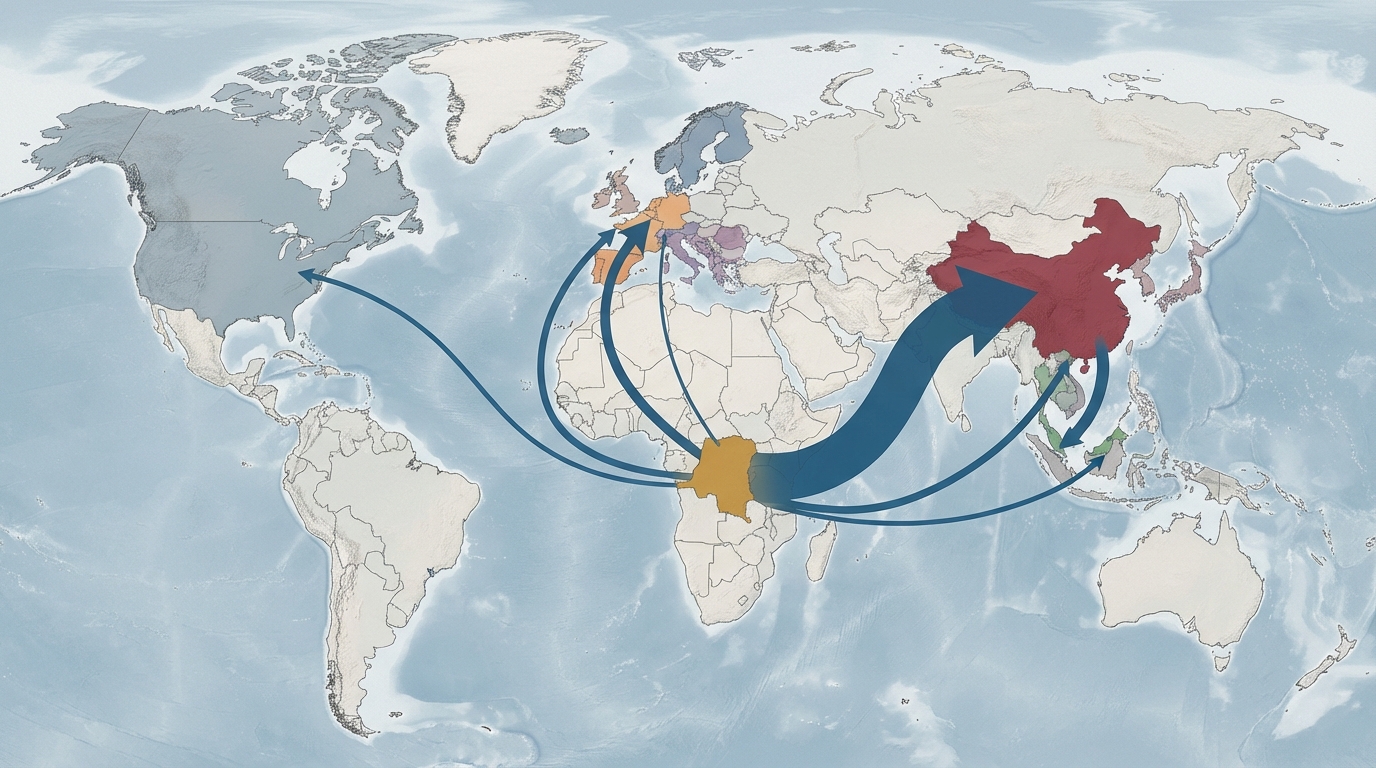
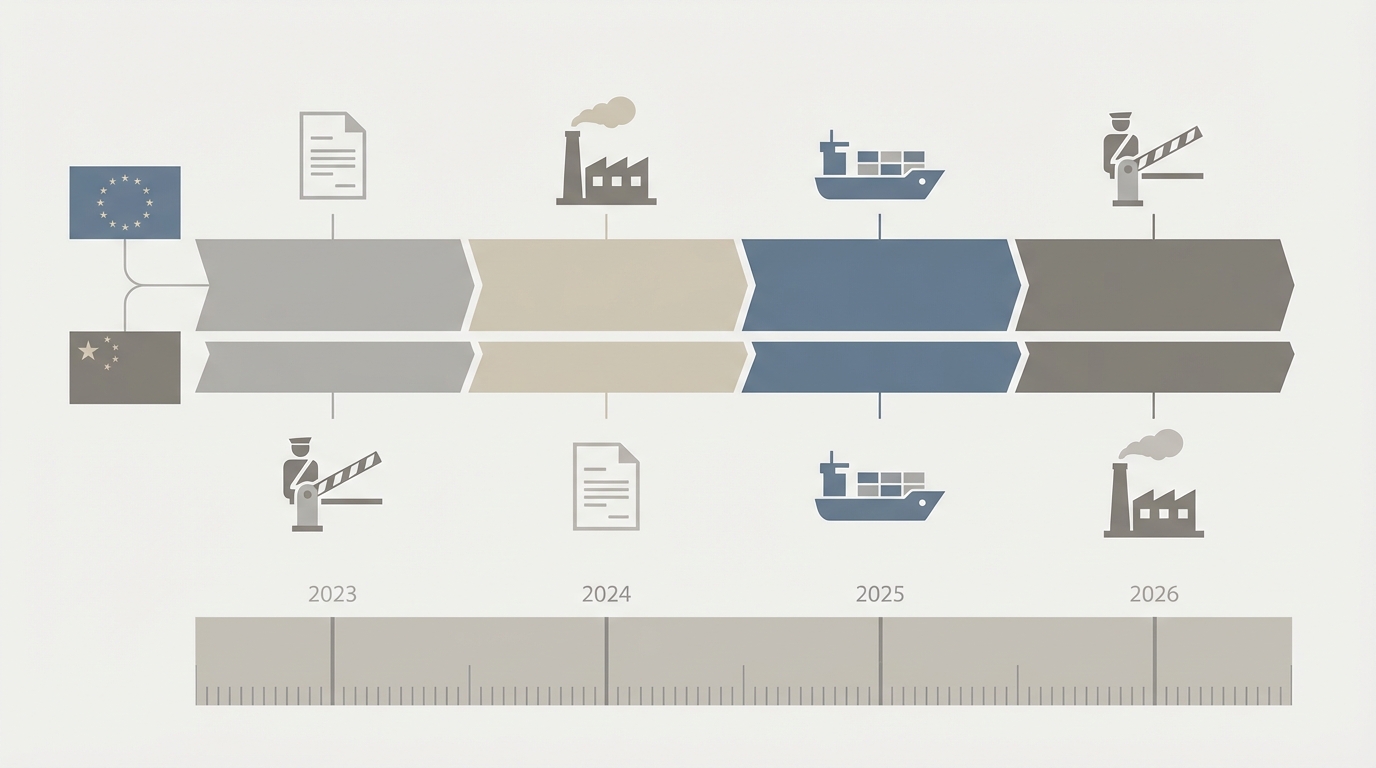
    4. Global Supply Architecture and Geographic Concentration

    Public sources including the USGS, company disclosures, and specialist commodity analyses consistently highlight that China dominates yttrium oxide refining capacity and a large share of mining, particularly through the Bayan Obo complex in Inner Mongolia and ionic clay operations in the south.[3,7,8] A limited number of non‑Chinese actors—most prominently Lynas (Australia/Malaysia) and MP Materials (United States)—have begun to bring meaningful non‑Chinese yttrium oxide volumes to market, though typically as part of broader REE product slates rather than as stand‑alone yttrium plays.

    Metal production is even more concentrated, with a small set of Chinese refineries historically handling most oxide‑to‑metal conversion and a handful of pilot or early‑stage projects in North America and elsewhere exploring domestic metallisation routes, often co‑funded under defense or critical‑minerals initiatives.[3,8]

    Form Representative Producers (2024–2025) Indicative Capacity (MT/year) Status Primary Constraint Highlighted in Public Sources
    Yttrium metal Ganzhou‑area refiners (China) Several hundred Operational Export licensing and allocation; purity control for aerospace grades
    Yttrium metal U.S. pilot plants (e.g., defense‑linked projects) Tens (pilot scale) Development / early operations Scale‑up, molten‑salt cell durability, and permitting
    Y₂O₃ oxide Chinese REE processors (e.g., Baotou, Longnan regions) Thousands Operational Export quotas, environmental compliance, tailings management
    Y₂O₃ oxide Lynas (Australia / Malaysia) Several hundred (design scale) Operational / ramping Feed composition, heavy‑REE balance, and downstream qualification
    Y₂O₃ oxide MP Materials (U.S.) Building from tens toward hundreds Ramping Integration of separation capacity and customer qualification

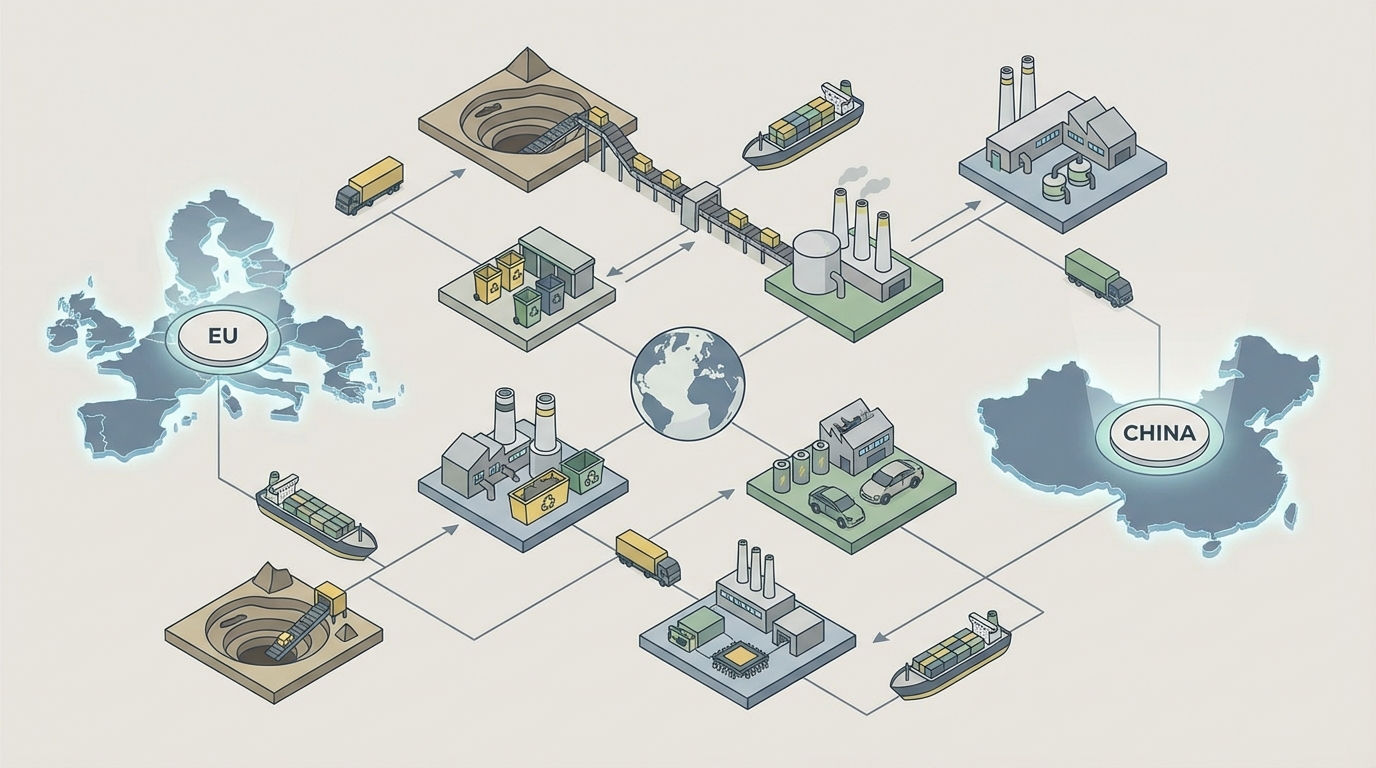
    Several structural features stand out:

    • Concentration of refining. While geological occurrences of yttrium are more widespread, practical refining capacity for high‑purity Y₂O₃ remains heavily concentrated in China. Non‑Chinese plants are still establishing long operating histories and qualification track records.
    • Metal as a niche within a niche. Metal production is not just a subset of oxide production; it depends on dedicated high‑temperature and electrochemical infrastructure that only a few sites operate at scale.
    • Co‑product dynamics. Because yttrium is usually co‑produced with other REEs, increases in yttrium output require either higher total REE throughput or a re‑optimised separation train. Both are capital‑ and time‑intensive.

    In practical terms, this means that sourcing strategies anchored in non‑Chinese oxide and domestically metallised feed remain in a building phase through 2025. For downstream sectors—especially those with strict defense or critical‑infrastructure classifications—that lag is a core operational consideration.

    5. Process Bottlenecks and Operational Risk Points

    5.1 Separation and refining bottlenecks

    The most technically demanding step in yttrium’s journey is often not mining but separation. Multi‑hundred‑stage solvent extraction circuits blur the boundaries between chemistry and continuous‑flow engineering. Common failure modes observed in industry case studies include:

    • Organic phase degradation under oxidative or thermal stress, leading to loss of extractant performance and contamination.
    • Phase disengagement issues as feed composition drifts, which can cause carry‑over of impurities and reduce stage efficiency.
    • Throughput‑purity trade‑offs, where pushing higher flow reduces residence time and degrades separation, particularly for closely neighbouring heavy REEs.

    Yttrium’s position among heavy rare earths means that small drifts in SX performance can have disproportionate effects on Y₂O₃ purity or recovery, especially when circuits are also tuned for dysprosium or terbium extraction. Plants targeting high‑purity Y₂O₃ often accept lower throughput or more recycles to maintain target specs, raising operating costs and lengthening lead times.

    5.2 Oxide–metal conversion and purity specifications

    On the metal side, calciothermic reduction and molten‑salt electrolysis introduce their own bottlenecks:

    • Current efficiency and cell life. Elevated temperatures (~800°C) and reactive halide melts place mechanical and chemical stress on electrodes and linings. Electrolyser downtime for maintenance or relining directly caps annual output.
    • Impurity control. Calcium, oxygen, chlorine, and transition metals all need to be controlled within tight bands for aerospace and superconducting applications. Every refining step that tightens impurity windows sacrifices some yield.
    • Scale limitations. Industry descriptions of batch sizes in the 50–100 kg class underscore how far yttrium remains from bulk metals such as aluminium or copper in process scale. Scaling out via multiple cells is possible but multiplies capital and maintenance requirements.

    One practical implication: “oxide‑first” sourcing followed by just‑in‑time metallisation looks attractive on paper but can collide with real‑world electrolysis capacity limits and qualification bottlenecks for high‑purity metal.

    5.3 Environment, safety, and regulatory pressure points

    Environmental and safety regulation increasingly shapes yttrium’s operational landscape:

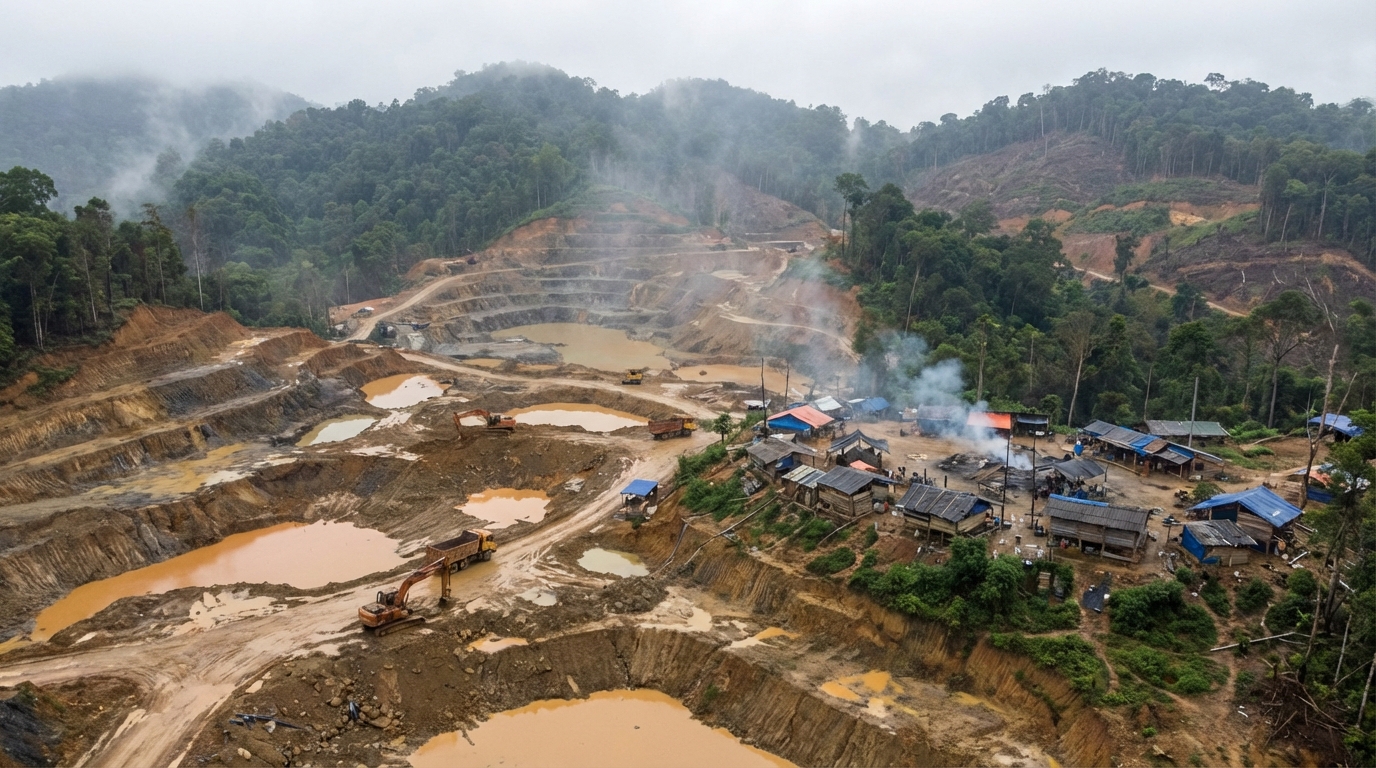
    • Tailings and waste management. Rare earth separation plants generate tailings containing low‑level radioisotopes and chemical residues. Several publicised incidents at REE plants in China and elsewhere have tightened local enforcement and increased effective downtime for inspections and remediation.[3,8]
    • Impurity limits in products. Frameworks such as EU REACH are progressively lowering allowable heavy‑metal impurities in chemicals, including yttrium oxide. Meeting these limits can require more aggressive purification, higher reagent use, and more sophisticated waste treatment.
    • Hazard classification. Yttrium metal powders and turnings can fall under flammable solid or spontaneously combustible classifications, constraining allowable packaging, warehouse conditions, and freight modes. That classification propagates through insurance and transport‑planning decisions.

    These factors do not eliminate yttrium flows, but they introduce additional sources of unplanned downtime, capex for mitigation, and permitting risk—particularly for new non‑Chinese projects seeking social licence to operate.

    5.4 Logistics friction and route vulnerability

    Because yttrium volumes are moderate but highly value‑dense, logistics choices tend toward containerised sea freight for oxide and a mix of sea and air for higher‑value oxide and metal. Several friction points stand out:

    • Metal freight constraints. Hazardous‑material labelling for pyrophoric‑risk forms reduces the pool of carriers and aircraft that will accept yttrium metal, especially in powdered or granular form. This can lengthen booking lead times and increase freight rates compared with oxide.
    • Route disruptions. Deviations around constrained maritime corridors can add weeks to shipping times between Asian producers and European or North American consumers. For just‑in‑time operations, that effectively widens safety‑stock requirements.
    • Port and customs scrutiny. Dual‑use concerns and export‑control regimes drive more detailed paperwork and occasional inspections for high‑purity metal and certain oxide grades, particularly when end‑uses intersect with defense or advanced electronics.

    One revealing observation from logistics data is that yttrium metal does not behave like a standard minor metal from a freight perspective; it behaves more like a specialty chemical or energetically reactive material, with all the scheduling and compliance overhead that implies.

    6. Observed Sourcing Patterns and Trade‑offs in 2024–2025

    6.1 Oxide‑centric strategies in electronics and optics

    In LEDs, displays, and optical ceramics, most downstream actors continue to treat high‑purity Y₂O₃ as the primary control lever rather than considering metal. Several trends are visible in public disclosures and industry interviews:

    Process flow from ore to yttrium oxide and yttrium metal, highlighting key bottlenecks.
    Process flow from ore to yttrium oxide and yttrium metal, highlighting key bottlenecks.
    • Diversification of oxide origin. There is visible interest in qualifying yttrium oxide from non‑Chinese refiners such as Lynas and emerging Western projects, even at a unit‑cost premium, to reduce single‑country exposure for critical phosphor and ceramic feedstocks.[3,5]
    • Tighter long‑term supply agreements. Where material functions are hard to substitute (e.g., specific phosphor blends or laser‑host powders), longer‑term contracts and collaborative process optimisation are becoming more common, trading some price flexibility for continuity and joint quality control.
    • Segmentation by grade. Commodity‑grade oxide for generic ceramics is increasingly decoupled from higher‑spec electronics/optics grades, with distinct supplier sets and qualification paths.

    The operative trade‑off in this segment tends to be cost versus geopolitical and quality risk, rather than oxide versus metal form. The metal route does not compete technically with high‑purity oxide for these applications.

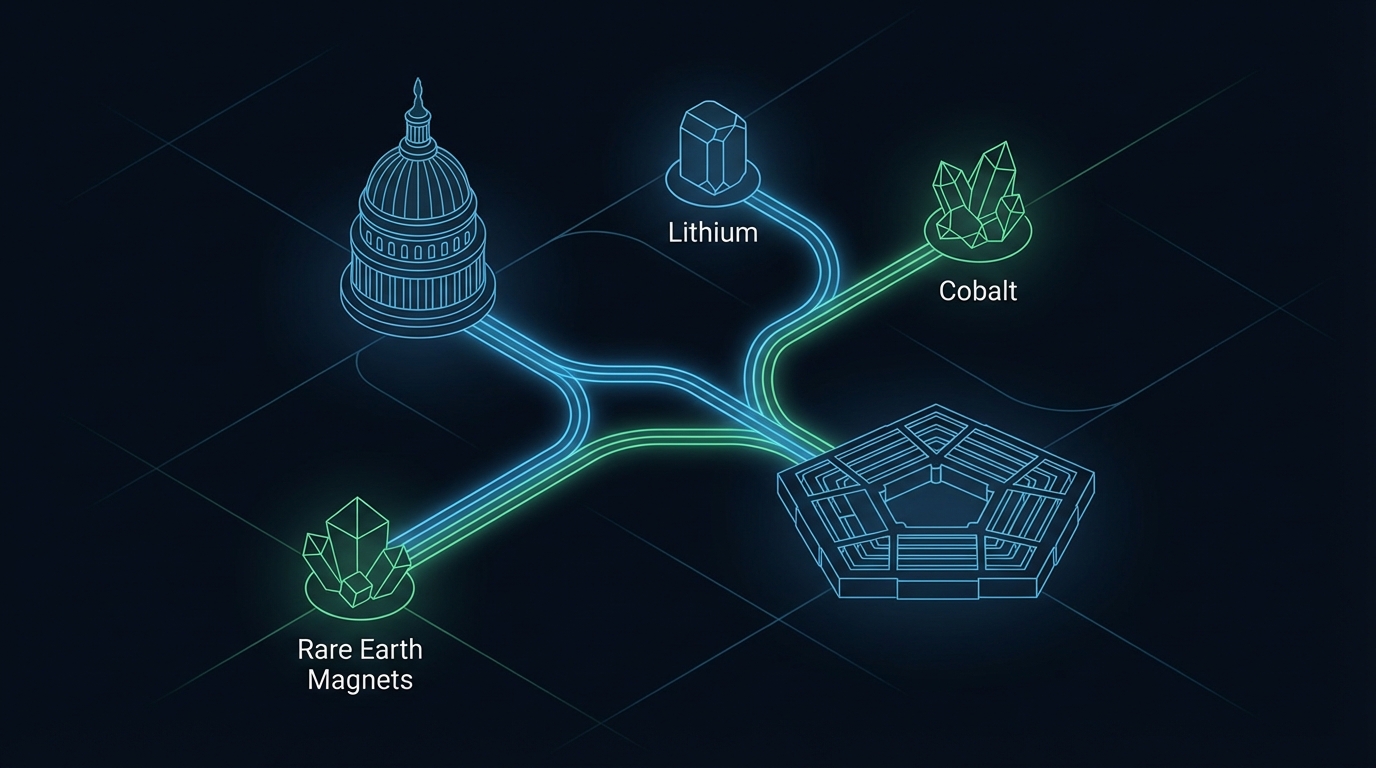
    6.2 Defense and aerospace: preference for traceable metal and controlled oxide streams

    Defense‑linked aerospace programs place particular emphasis on domestic or allied‑origin yttrium streams, both for metal and for certain high‑purity oxides entering thermal barrier coatings and advanced ceramics. Public documents associated with national defense authorizations and critical‑minerals strategies highlight:

    • funding for pilot and demonstration plants capable of oxide‑to‑metal conversion within national borders,
    • qualification of specific refiners against stringent impurity specifications for turbine and structural alloys, and
    • closer integration between mining, separation, and metallisation to improve traceability and reduce dependence on foreign intermediary refiners.[3,7,8]

    These efforts reflect a strategic calculus: although total metal tonnage is modest, availability of certified, traceable, high‑purity yttrium metal and oxide can become a single‑point failure for particular propulsion or sensor systems. In this niche, the premium for secure metal supply is a function of industrial resilience rather than commodity pricing.

    6.3 Energy technologies: managing YSZ and superconductor supply

    Growth in SOFC deployments, hydrogen infrastructure, and advanced power systems has put additional attention on YSZ and YBCO precursor supply. Observed patterns include:

    • Integrated YSZ supply chains. Several YSZ producers source yttrium oxide via long‑term arrangements with REE refiners, sometimes with back‑to‑back clauses tying volumes to publicly announced fuel‑cell or turbine projects.
    • Specification‑driven sourcing. SOFC electrolyte formulations often have narrow windows for Y₂O₃ content (e.g., 8–10 mol%) and impurity levels. Changes in oxide origin that affect minor impurities, particle morphology, or surface chemistry can require requalification of entire stack designs.
    • Regional balancing. In regions pursuing aggressive decarbonisation policies, there is growing interest in localising at least part of the YSZ and superconductor feedstock chain to reduce dependency on geopolitically exposed supply routes.

    Here again, oxide remains the dominant form; metal demand is limited to specific alloying roles in ancillary components. The main trade‑offs revolve around security of high‑spec oxide supply versus cost and flexibility.

    6.4 Risk‑management practices observed across the chain

    Across sectors, several operational risk‑management patterns around yttrium have become visible in 2024–2025, framed explicitly as industrial resilience rather than financial optimisation:

    • Enhanced material qualification and testing. High‑spec users commonly rely on techniques such as ICP‑MS for oxide and GDMS for metal to verify that delivered product meets declared purity and impurity profiles, particularly for new suppliers or origins.
    • Upstream traceability and ESG audits. There is growing attention to mine‑of‑origin data, REE balance, tailings practices, and community impacts, both for compliance with emerging regulations and for reputational risk management.
    • Scenario analysis around export controls and quotas. Some downstream actors model multi‑month disruptions to specific producing countries or refiners, assessing the impact on production schedules and identifying points where alternative suppliers or temporary design changes might be technically viable.
    • Form diversification. In limited cases, holding a portion of yttrium as oxide and a portion as pre‑qualified metal has been used to buffer against conversion bottlenecks or sudden shifts in regulatory treatment of particular forms.

    These practices reflect a recognition that yttrium’s most material risks arise where technical specifications, process bottlenecks, and geopolitical controls intersect, rather than from headline tonnage alone.

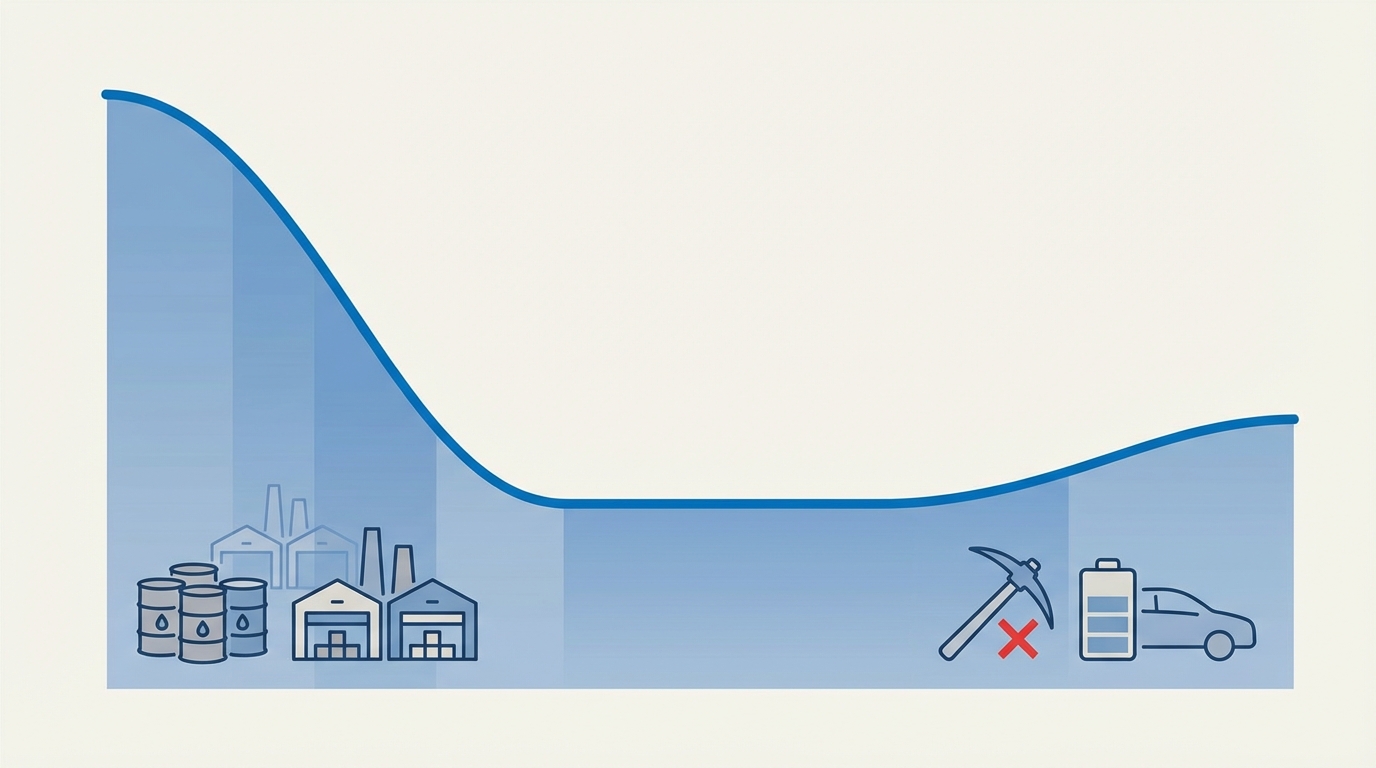
    7. Conclusion: Yttrium as a Lever Point in the Rare Earths System

    Yttrium illustrates how a single element can sit at the crossroads of ceramics, alloys, and advanced functional materials while remaining structurally constrained by midstream processing and regulatory overlays. The oxide/metal split effectively creates two parallel markets: a larger, more commodity‑like oxide market dominated by Chinese refining, and a smaller, tightly specified metal and high‑purity oxide segment that underpins aerospace, defense, and critical energy systems.

    Technically, the hardest problems are no longer in mining but in solvent extraction, oxide purification, and molten‑salt electrolysis. These unit operations define recoveries, purities, and throughput, and they are where most ESG, safety, and permitting pressures apply. “More ore” does little to alleviate short‑term risk unless it connects to separation and metallisation capacity that meets end‑use specifications.

    For engineering, procurement, and compliance teams, the structure of yttrium’s processing chain explains why disruptions at a single SX complex or metallisation plant can ripple into apparently distant sectors such as MRI magnets, turbine blades, or industrial lasers. Once specific Y₂O₃ powders or Y‑containing alloys are embedded in qualified designs, substitution ceases to be a simple sourcing decision and becomes a multi‑year technical program.

    From TI22 Strategies’ perspective, yttrium sits among the more subtle but consequential levers in the broader rare earths system: small in tonnage but large in strategic impact. Ongoing analysis therefore tracks not only headline production data but also weak signals in separation technology, molten‑salt process scale‑up, ESG regulation, and export‑control policy that are likely to redefine yttrium’s risk profile over the coming years.

    Note on the TI22 methodology TI22 Strategies combines systematic monitoring of regulatory texts (including export control updates and environmental mandates), high‑frequency trade and production data, and close reading of technical specifications in downstream sectors such as turbines, fuel cells, and semiconductor equipment. This cross‑view allows early identification of mismatches between qualifying material requirements and the evolving capabilities and constraints of yttrium mining, separation, and metallisation infrastructure.

    Sources and further reading

    • Honrel – “Top 10 Applications of Yttrium Oxide”[1]
    • Stanford Advanced Materials – “Yttrium: Element Properties and Uses” and related technical notes[2,6]
    • Tradium – Yttrium industry product data and application briefs[3]
    • AEM REE – Yttrium facts and application overviews[4]
    • Parchem – “Yttrium Oxide Uses in Electronics, Ceramics and Energy Applications”[5]
    • EBSCO / research‑starter entries on yttrium geology and uses[7]
    • AZoM – “Yttrium – Properties and Applications” and related property databases[8]
    • USGS – “Rare Earths Statistics and Information” (yttrium within REE statistics)
    • Lynas and MP Materials – public operations updates and technical disclosures on REE separation, including yttrium‑bearing streams
  • Myanmar’s rare earth dependency: china’s hidden supply chain: Latest Developments and Analysis

    Myanmar’s rare earth dependency: china’s hidden supply chain: Latest Developments and Analysis

    **Myanmar’s ionic clay deposits in conflict-affected Kachin State now provide roughly half or more of China’s heavy rare earth element (HREE) inputs, while China retains an estimated 99% share of global HREE separation capacity as of 2023.[3][4] This creates a compounded “double chokepoint”: upstream exposure to Myanmar’s civil war and non-state armed control over mines, and midstream exposure to China’s Ministry of Commerce (MOFCOM) export licensing-expanded in October 2025 to cover all HREEs such as dysprosium, erbium, holmium, thulium, and ytterbium.[2][3] The result is a structurally fragile supply base for high-temperature permanent magnets used in EV motors, wind turbines, and defense systems, where HREEs deliver coercivity and thermal stability. The core technical reality is that low-cost but environmentally destructive ionic clay leaching in Myanmar feeds into highly specialized Chinese solvent extraction and metal-making capacity that currently lacks scalable substitutes elsewhere.**

    Myanmar’s Rare Earth Dependency: China’s Hidden Heavy Element Backbone

    Myanmar has moved from peripheral player to central node in the heavy rare earth element (HREE) ecosystem. Ionic clay deposits in Kachin State, near the Chinese border, now supply approximately 50% or more of China’s HREE inputs, according to analyses drawing on Institute for Strategy and Policy-Myanmar and industry data.[3][4][6] Almost all of this material crosses the land border for processing in Chinese hubs such as Guangdong, Jiangxi, and Gansu, where state-backed firms and companies like Shenghe Resources operate separation plants and metal smelters.

    At the same time, China holds a near-monopoly in the midstream. Heavy REE separation and purification capacity is heavily concentrated there, with estimates cited in policy work pointing to around 99% of global HREE processing as of 2023.[3] This configuration creates a single-country-within-single-country bottleneck: Myanmar is the primary external source of HREE-rich feedstock, and China is the indispensable processor, particularly for dysprosium, terbium, erbium, holmium, thulium, and ytterbium used in high-performance permanent magnets and optics.

    The operational question for advanced manufacturing and defense supply chains is not abstract geopolitics. It is the reliability of specific ionic clay pits in Kachin and Shan, the stability of trucking routes to the Ruili-Muse crossing, the continuity of Chinese solvent extraction (SX) lines, and the policy behaviour of MOFCOM’s export licensing regime. Every technical weakness in this chain-whether a washed-out road in northern Myanmar or a batch failure in a Chinese SX circuit-propagates into potential disruption for EV traction motors, offshore wind nacelles, radar systems, and guided munitions.

    1. Strategic Context: Double Chokepoint in Heavy Rare Earth Supply

    Between 2017 and 2024, Myanmar-origin concentrates reportedly accounted for 60%-87% of China’s rare earth imports each year, based on data compiled by the Institute for Strategy and Policy-Myanmar (ISP-Myanmar).[1] Total Myanmar output is estimated around 23,000-27,000 metric tons (MT) of rare earth concentrates annually, with a heavy skew toward HREEs due to the ionic clay geology in Kachin.[5][6] Nearly all of this tonnage is exported to China rather than processed domestically.

    From China’s perspective, this configuration has been rational. Environmentally destructive mining and leaching are externalised to Myanmar, where regulation is weak and enforcement highly uneven, while China retains control over midstream refining and alloy production. Concentrates cross the border into Yunnan, then move to established processing clusters in provinces such as Jiangxi and Guangdong. There, they enter sophisticated circuits of crushing, leaching, solvent extraction, precipitation, and reduction to produce oxides and metals suitable for magnet manufacturing and other downstream uses.[3][4]

    This results in what can be described as a double chokepoint:

    • Upstream chokepoint – Kachin-centric mining risk: Around 90% of Myanmar’s rare earth output emerges from Kachin State, much of it under the control or tax regime of the Kachin Independence Army (KIA), an armed group in an active civil conflict.[1][7] Production is exposed to front-line shifts, localized ceasefires, and informal taxation arrangements.
    • Midstream chokepoint – MOFCOM export licensing: China’s Ministry of Commerce expanded export controls in October 2025 to cover a broad suite of HREEs and related technologies.[2][3] Licenses are now granted case by case, enabling differential rationing between domestic magnet manufacturers and foreign end-users.

    The compounding effect is significant. Civil war dynamics in Myanmar can interrupt feedstock flows to Chinese refineries, while regulatory and foreign policy choices in Beijing can throttle outbound shipments of oxides, metals, or alloys. For sectors where HREE substitution is technologically constrained—high-temperature NdFeB magnets in EV drivetrains and some defense systems are prime examples—this architecture hard-wires fragility into long-term industrial planning.

    2. Technical Foundations: Ionic Clay Mining and Chinese HREE Processing

    2.1 Geology of Ionic Clay Heavy Rare Earth Deposits in Myanmar

    The rare earth deposits of northern Myanmar are primarily ionic adsorption clays—weathered profiles of granitic and felsic rocks in which rare earth elements (REEs) are weakly adsorbed onto clay minerals rather than tightly bound in crystalline lattices. These deposits typically exhibit:

    • Enrichment in HREEs such as dysprosium, terbium, erbium, holmium, thulium, and ytterbium, relative to light rare earth elements (LREEs) like neodymium and praseodymium.[3][6]
    • Near-surface occurrence (often within tens of meters of the surface), enabling shallow open-pit or strip mining with limited overburden removal.
    • Relatively low grades by hard-rock standards but with simple leachability, which lowers capital intensity for extraction compared with bastnäsite or monazite hard-rock ores.

    The ionic nature of these deposits means REE-bearing cations can be displaced from clay surfaces using simple salt solutions—most commonly ammonium sulfate in Chinese practice. This chemistry is central to Myanmar’s cost profile: it enables small operators, often working under informal arrangements with Chinese buyers, to conduct economically meaningful extraction with modest equipment fleets and very limited environmental controls.[5][7]

    2.2 Mining and Leaching Flowsheets in Kachin and Shan

    Field reporting from Kachin State and analytical work such as East Asia Forum’s coverage of the “rare earth gold rush” describe a highly simplified upstream flowsheet compared with integrated operations in China or Australia.[5][7] Typical steps include:

    • Shallow open-pit mining: Small to mid-scale excavators and bulldozers remove vegetation and overburden, exposing clay horizons. Blasting is limited; material is soft enough for mechanical digging.
    • On-site beneficiation: Clay-rich ore is often screened or washed to remove coarse fractions, though this step can be minimal in informal sites. The objective is to create a relatively uniform fine-grained feedstock for leaching.
    • Heap or pond leaching: Ammonium sulfate or similar salt solutions are applied to heaps or pumped through ad-hoc leach ponds. Pregnant leach solution (PLS) containing dissolved REEs is collected in lined or, frequently, unlined ponds.
    • Crude precipitation: Lime or other reagents precipitate REE-bearing mixed carbonates or hydroxides, which are filtered, dried, and sold as “concentrates” to Chinese buyers.[5][7]

    Where Chinese joint ventures are more directly involved—such as at Panwa, Chipwi, and some Laiza-area operations—equipment sets can be more structured, with agitated leach tanks, lined ponds, and basic process control. Recovery rates in these more organized sites are reported in the range of roughly 70% for some deposits, although this figure is source-dependent and varies by ore and operational discipline.[5][6]

    From an operational-risk perspective, the simplicity of the flowsheet is a double-edged sword. On one hand, projects can be ramped quickly, with limited capital expenditure and short construction times. On the other, environmental safeguards, tailings management, and worker protections are frequently rudimentary, increasing the probability of regulatory backlash, social opposition, or international scrutiny that could disrupt operations.

    2.3 Environmental and Reagent Constraints

    Ionic clay leaching trades capital efficiency against environmental externalities. Ammonium sulfate and similar reagents can mobilize not only REEs but also other metals and contaminants. Without engineered liners, leak detection, and wastewater treatment, leachates migrate into soils and surface waters. Reporting on Kachin sites has documented impacts on streams feeding the Salween and other transboundary rivers.[1][5][7]

    Key technical constraints include:

    • Reagent consumption: High reagent use per tonne of concentrate where leaching is poorly controlled or where ore heterogeneity leads to over-application.
    • Water management: Dependence on consistent water supply for leaching and washing, with heightened risk during dry seasons or localized drought.
    • Waste handling: Absence of engineered tailings facilities at many sites increases the likelihood of slope failures, pond breaches, and chronic contamination.

    These environmental characteristics have direct implications for downstream compliance. As EU and other jurisdictions bring carbon border adjustment mechanisms (CBAM) and broader environmental due diligence into force from mid-2020s onward, rare earth oxides and magnet products traceable to environmentally non-compliant mining risk additional tariffs or even exclusion from specific public procurement channels.[1]

    2.4 Chinese Midstream: Solvent Extraction, Separation, and Metal Making

    Once Myanmar-origin concentrates enter China, the technical profile changes fundamentally. The midstream is capital and technology intensive, relying on complex separation flowsheets configured to tease apart chemically similar rare earths at high purities (often 99.5%–99.99% for magnet-grade oxides and metals).

    Typical Chinese processing of HREE-rich mixed concentrates involves:

    • Roasting and dissolution: Concentrates may be calcined in rotary kilns or multiple-hearth furnaces to decompose carbonates/hydroxides before dissolution in acid.
    • Primary impurity removal: Precipitation or ion-exchange steps remove iron, aluminum, and other gangue elements to prepare a cleaner REE solution feed.
    • Solvent extraction (SX): Multi-stage mixer–settler banks or pulsed columns separate individual REEs using tailored organic extractants. HREE separation is particularly demanding, often requiring dozens of stages for high-purity output.[3][4]
    • Oxide precipitation and calcination: Individual REE streams are precipitated (usually as oxalates or carbonates) and then calcined to oxides in kilns.
    • Metal production: For magnet feedstock, oxides are converted to metals or alloys via metallothermic reduction (often using calcium) or fused-salt electrolysis in specialized cells.

    This chain is energy and labour intensive. Large SX plants operate hundreds to thousands of mixer–settler stages, each requiring precise control of pH, phase ratios, and temperature. Downtime in any segment—reagent supply disruptions, power shortages, or environmental inspections—can rapidly translate into shortages of high-purity dysprosium, terbium, or erbium oxides needed by magnet alloy producers.

    A critical insight emerging from recent policy analysis is that HREE risk is no longer just about ore availability; it is about the integrity and policy exposure of these SX banks and metal-making lines concentrated within China. Myanmar’s ionic clays provide flexible feed, but without viable alternative separation hubs, midstream bottlenecks remain entrenched.[3][4]

    3. Twelve Key Myanmar Rare Earth Sites: Technical and Operational Profiles

    Public and semi-public datasets consolidated from 2024–2025 estimates highlight a cluster of at least 12 significant rare earth sites in Myanmar with direct impact on current HREE supply security. These can be ranked by strategic criticality (HREE content and relevance for defense/battery uses), supply deficit risk (dependence of Chinese processing on each source), and geopolitical friction (degree of exposure to conflict or sanctions).[1][5][6][7]

    3.1 Panwa Mine (Kachin State, Laiza Township)

    Capacity and status. Panwa is frequently cited as one of Myanmar’s largest ionic clay operations, with estimates of about 12,000 MT/year of rare earth concentrates and a ramp to full-scale operations in 2024.[6][7] Output is mainly in mixed concentrate form, with minimal on-site refining beyond basic precipitation and drying.

    Strategic role. Ore from Panwa is reported to have relatively high dysprosium and terbium content, with HREEs constituting roughly 15%–20% of total REE content by some accounts.[3] Local and regional commentary has characterised Panwa as contributing on the order of 40% of China’s HREE magnet feedstock, underscoring its systemic importance.[2][6]

    Map of Myanmar–China heavy rare earth flows and key mining regions.
    Map of Myanmar–China heavy rare earth flows and key mining regions.

    Operational realities. The mine has been under KIA influence or control since around 2021, with Chinese technical involvement, including leaching know-how linked to Shenghe Resources and affiliated Chinese contractors.[5][7] Roughly 90% of output is reportedly trucked through local roads to border crossings leading into Ruili, Yunnan. The workforce includes several thousand local labourers, with investigative reporting documenting exposure to leachate and potential arsenic runoff due to inadequate effluent management.[7]

    Key risks. Panwa illustrates the intersection of conflict, environmental risk, and supply criticality. 2025 clashes reportedly halted exports for around two months, a relatively brief disruption in political terms but significant at the scale of HREE supply given the concentration of output.[7]

    3.2 Chipwi Rare Earth Project (Kachin State, Chipwi Township)

    Capacity and status. Chipwi is assessed at around 8,500 MT/year of concentrate output at its 2024 peak.[6] Compared with more artisanal clusters, Chipwi is closer to an organised open-pit complex with defined benches and semi-permanent infrastructure.

    HREE profile and processing linkages. Chipwi’s clays are reported as particularly rich in ytterbium and holmium, important for aerospace laser optics and speciality alloys, feeding into China’s near-total control of holmium oxide supply.[3] Of particular note is the offtake link to the Longnan Rare Earth processing plant, indicating that feedstock composition at Chipwi can influence product mixes further downstream.

    Operational parameters. Sources describe a Chinese joint venture (JV) structure with an undisclosed Ganzhou-based partner, operating with more standardised flowsheets: open-pit mining, screened clay feed, controlled acid leaching, and organized PLS handling.[5] Recovery rates around 70% are cited for some circuits, although variability in ore and operational discipline remains significant.

    Friction points. The KIA is reported to levy a tax of around 20% on output, and logistics are periodically impaired by Ayeyarwady River crossings, which suffered from flooding in 2025.[1][7] These factors introduce both cost and reliability volatility into the Chipwi–Longnan supply linkage.

    3.3 Laiza Ionic Clay Deposit Cluster (Kachin State, Laiza Region)

    Capacity and status. Laiza-area operations are estimated at around 6,000 MT/year of concentrate output, with expansion underway through 2025.[7] The cluster is less a single mine than a grouping of pits and leach fields under overlapping local arrangements.

    Strategic profile. These deposits are significant sources of erbium and thulium, both of which are heavily concentrated in Chinese supply (90%–98% control in various estimates) and used in fibre-optic amplifiers and defence communications systems.[3]

    Technical features. Reports indicate that part of the Laiza cluster has piloted solvent extraction steps on-site using technology adapted from Vietnamese practice, with around 4,000 MT shipped in Q4 2024.[6] This suggests an early-stage move toward more value-added processing outside China, albeit at modest scale and under complex political control structures.

    Sanctions exposure. Full KIA oversight and Chinese JV involvement make this cluster a focal point for potential targeted sanctions. Analyses from 2025 raise the prospect of US or allied measures directed at specific Chinese entities active in Laiza-area mining and offtake.[2]

    3.4 Momaung Mine Cluster (Kachin State, Momaung Area)

    Capacity and structure. The Momaung area is assessed at about 4,200 MT/year of concentrate output.[6] Rather than a single integrated operation, it consists of more than 50 small pits consolidated via Chinese trading houses, which coordinate logistics and cross-border sales.

    HREE relevance. Dysprosium is the main strategic draw here, feeding into high-temperature permanent magnets for military drones and other demanding environments.[2] Because the cluster’s cumulative output is sizeable and dysprosium-rich, disruptions can influence price and availability despite the artisanal nature of many individual pits.

    Diagram of the Myanmar-to-China heavy rare earth supply chain and end uses.
    Diagram of the Myanmar-to-China heavy rare earth supply chain and end uses.

    Conflict overlay. Momaung lies along fluctuating front lines between junta forces and the KIA, with reporting of around 30% output loss in 2025 due to conflict and access issues.[7] This volatility makes Momaung a high-variance contributor to the overall Myanmar–China HREE flow.

    3.5 Tanai Valley Deposits (Kachin State, Tanai)

    Development status. Tanai is characterised as a development-stage cluster, with an estimated 3,800 MT/year trajectory and first output in Q1 2025.[7] Early production has been in pilot mode, with around 200 MT reportedly leached on-site to test flowsheets and ore response.[6]

    Ore mix. The Tanai valley appears to host a heavier REE mix suitable for battery cathode chemistries (for example in some NMC formulations) in addition to magnet applications, although detailed publicly available assay data remain limited.[3]

    Operational headwinds. Artillery fire and shifting conflict lines have repeatedly interrupted exploration and development activities. Environmental restrictions on paper have been widely ignored, according to local sources and analytical reporting, reinforcing reputational and compliance risk if Tanai-linked material enters regulated downstream markets.[1]

    3.6 Nambu Area Mines (Kachin State, Near China Border)

    Capacity and logistics. With an estimated 2,900 MT/year of concentrate output, Nambu is significant but secondary compared with Panwa or Chipwi.[6] The area relies heavily on truck convoys moving approximately 100 MT/day to Yunnan via flood-prone routes.[5]

    Product profile. Terbium appears to be a key target, used in phosphors for LED displays and, in smaller volumes, in specialized magnets and sensors.[3] Supply disruptions so affect both consumer electronics and more niche industrial uses.

    Regulatory and weather risks. Flood risk and landslides periodically shut transport routes. On the Chinese side, export license processing delays add another layer of variability, especially for terbium oxide and metal shipments that fall under tightened MOFCOM scrutiny.[2]

    3.7–3.12 Secondary but Emerging Sites

    Beyond the core Kachin clusters, several additional sites contribute smaller but strategically non-trivial volumes:

    • Shan State exploratory sites (near Mandalay): Around 1,500 MT/year in test production as of 2025, with secondary HREE output for industrial catalysts and some magnet feedstock. Junta control is complicated by incursions from ethnic armed groups, and some pilots reportedly draw on Vietnamese technical transfer.[1][7]
    • Myitkyina periphery deposits: Approximately 1,200 MT/year, with ytterbium output relevant for medical imaging magnets and specialty alloys. Urban conflict spillover around Myitkyina raises safety and logistics concerns; river barge routes to China have been used to bypass congested roads.[3][5][7]
    • Hpakant adjacent clays (jade region): Around 900 MT/year in development, leveraging existing jade mining infrastructure. Dysprosium is produced as a co-product, with at least 500 MT reportedly stockpiled in 2025. Overlap with jade cartels introduces smuggling and traceability risk.[2][5][6]
    • Putao district prospects: Estimated 700 MT/year potential at exploration stage, with drone-based mapping and early assays indicating erbium potential. Remote terrain and limited infrastructure are the primary constraints; Chinese foreign direct investment (FDI) interest is reported but not yet crystallised.[1][6][7]
    • Sagaing exploratory zones: Approximately 500 MT/year of very early-stage output with a mixed LREE–HREE profile relevant for batteries and general industrial uses. Political instability in central Myanmar and early-stage project status make this more a future option than a current supply pillar.[1][7]
    • Rakhine coastal clays: Around 300 MT/year in stalled exploration as of 2025, with minor HREE potential and unproven offshore extensions. The combination of Arakan Army control and cyclone damage has effectively frozen serious development.[5][6][7]

    These sites collectively underpin an estimated potential of roughly 38,000 MT/year of rare earth concentrates. Conflict and operational disruption reportedly reduced effective 2025 output by around 25%, tightening Chinese HREE inventories and contributing to dysprosium price increases in the mid-teens percentage range quarter-on-quarter.[2][6] The headline insight is that a relatively small number of districts in northern Myanmar now function as swing suppliers for globally critical HREE streams.

    4. Geopolitical and Logistical Bottlenecks Along the Myanmar–China Corridor

    The spatial concentration of Myanmar’s rare earth mining in Kachin State creates pronounced single-region risk. Analyses estimate that Kachin accounts for approximately 90% of Myanmar’s rare earth output, with KIA-aligned structures playing central roles in mine permitting, taxation, and security.[1][7] Chinese buyers, including traders and SOE-affiliated offtakers, are the primary revenue counterparties, with some estimates suggesting around $100 million per year in payments to KIA-linked entities.

    The main logistics artery runs through the Ruili–Muse border crossing, which reportedly handles around 95% of rare earth concentrate exports from Myanmar into China.[5] This route is highly exposed to:

    • Border closures and skirmishes: Q3 2025 saw border posts shut for approximately 45 days due to escalated fighting and security incidents, delaying shipments estimated at 5,000 MT of concentrate.[1][7]
    • Weather shocks: Monsoon-related landslides and flooding periodically cut road access, particularly for Nambu and Chipwi convoys.
    • Regulatory and sanctions risk: Any coordinated measures targeting KIA financing, jade–rare earth smuggling networks, or specific Chinese JVs could directly hit cross-border flows.

    On the Chinese side, the expanded MOFCOM licensing regime—covering HREE oxides, metals, and relevant processing technologies since October 2025—adds a structured gate to onward exports.[2][3] Licenses are granted on a per-transaction or per-counterparty basis. Reporting indicates that even after a June 2025 truce in Myanmar, Chinese rare earth compound exports remained below historical baselines, suggesting a deliberate rationing to prioritise domestic magnet manufacturers and strategically important foreign customers.[2]

    In parallel, environmental scrutiny is tightening. Unchecked leaching in Myanmar’s ionic clay fields has drawn increasing criticism, and there is credible expectation that EU carbon border adjustment and related mechanisms will begin to penalise supply chains associated with high-impact upstream practices from around 2026.[1] The combination of civil conflict, export licensing, and environmental regulation turns what might appear as a straightforward ore supply story into a complex matrix of operational and policy bottlenecks.

    5. Operational Risk, Compliance, and Process Integrity

    From an industrial resilience perspective, the Myanmar–China HREE chain exhibits multiple intertwined risk vectors: technical, environmental, social, and regulatory. Each has distinct failure modes and time horizons.

    5.1 Technical and Process Risks

    Upstream ionic clay operations in Myanmar are vulnerable to:

    • Ore variability: HREE grades vary across pits and horizons, which can disrupt consistent feed chemistry for Chinese SX circuits. Without robust geological modelling, small operators may shift into lower-grade zones without adjusting leach parameters, degrading recovery.
    • Process discipline: Informal or rapidly expanded sites often lack reliable pH control, reagent dosing, or pond integrity. This results in inconsistent concentrate quality (impurity profiles, moisture content) and variable recovery performance.
    • Infrastructure fragility: Ad-hoc road networks, makeshift bridges, and underspecified storage yards create exposure to extreme weather, accidents, and theft.

    Midstream Chinese plants, though more sophisticated, face their own technical risk envelope: high dependence on continuous power and water supply, stringent environmental emissions requirements, and the complexity of SX circuits where contamination or phase instability in one bank can cascade across multiple products.

    A rare earth ionic clay mine in a conflict-affected border region.
    A rare earth ionic clay mine in a conflict-affected border region.

    5.2 Environmental and Social Compliance Risks

    Ionic clay REE extraction has become emblematic of “outsourced pollution.” In Myanmar, key compliance challenges include:

    • Leachate and tailings: Weak enforcement and limited monitoring mean leachate controls are often absent or ineffective. Acidic or saline solutions laden with dissolved metals infiltrate groundwater and surface water, with reported downstream effects on agriculture and fisheries.[5][7]
    • Land rights and community consent: In zones of overlapping claims between the junta, KIA, and local communities, the process for establishing mine access is opaque. This heightens the risk of future disputes, forced relocations, or ex-post legal challenges.
    • Labour conditions: Use of local casual labour and, in some reports, underage workers at small pits creates exposure to international scrutiny and potential trade restrictions tied to labour standards.[7]

    Downstream, any magnet or component producer seeking to align with emerging EU or US critical minerals standards must contend with these upstream realities. Traceability systems that can distinguish HREEs originating from relatively better-managed operations versus highly destructive sites may become decisive for market access, not just public perception.

    5.3 Data, Transparency, and Traceability Gaps

    There is substantial uncertainty in basic data: ore grades, recovery rates, true production volumes, and the exact ownership/control structure of many Myanmar mines. Estimates presented in regional analyses and think-tank reports often diverge, reflecting both the opacity of the sector and rapidly changing on-the-ground conditions.[1][5][6][7]

    This opacity complicates any attempt to build robust mass-balance traceability across the chain. Blending of concentrates from multiple pits, consolidation by Chinese traders, and limited documentation at border crossings mean that, in many cases, Chinese refineries handle mixed-feed lots where the original pit of origin is effectively irrecoverable. That, in turn, makes it difficult to isolate exposure to specific high-risk assets or actors when assessing compliance with sanctions or environmental standards.

    6. Emerging Responses: Diversification, Technology Options, and Scenario Space

    States and industrial actors are not static in the face of this dependency. Policy reports and industry disclosures highlight a variety of responses centered on diversification of supply, technology adaptation, and stockpile management, all framed increasingly as continuity-of-operations and industrial resilience challenges rather than short-term commercial plays.[2][3][4]

    6.1 Geographic Diversification and New Processing Hubs

    US and EU initiatives in 2024–2025 have targeted Southeast Asian partners such as Vietnam, Thailand, and Malaysia with cooperative agreements on critical minerals.[1][3] These efforts aim to leverage:

    • Vietnam’s Dong Pao and other deposits, where HREE-rich ores are being evaluated for ramp-up around 2026, with some analyses citing potential output on the order of a few thousand MT/year.[3][4]
    • Malaysia’s existing rare earth infrastructure, including processing experience in Perak and elsewhere, with pilot-scale HREE handling capacity proposed as a way to create alternative oxide supply outside China.[1][4]
    • Australian and other Tier-1 jurisdictions’ projects, such as Browns Range in Western Australia, which target dysprosium-rich output at modest initial scales.[4]

    These initiatives confront non-trivial technical and environmental hurdles. Bringing new separation capacity online for HREEs requires not only capital but also deep process expertise in SX chemistry, waste management, and product qualification for magnet makers. The learning curve is measured in years, not quarters, particularly for facilities aiming to reach magnet-grade specifications at high yields.

    6.2 Technology Adaptation and Material Efficiency

    Parallel to geographical diversification, technology-side responses are emerging:

    • HREE-lean magnet designs: Motor and generator manufacturers continue to explore designs that lower dysprosium or terbium inclusion while maintaining performance, through grain boundary diffusion techniques, improved cooling, or alternative magnet topologies. These approaches reduce but do not eliminate HREE dependency, especially for extreme-temperature or high-coercivity defense applications.
    • Recycling and urban mining: Scrap magnets from manufacturing and end-of-life equipment provide a secondary HREE source. However, recovery processes still rely on sophisticated hydrometallurgy and are, in practice, capacity-constrained compared with primary supply.[3][4]
    • Substitution in non-critical uses: Some applications can shift from HREE-intensive materials to LREE- or ferrite-based alternatives, freeing limited HREE output for mission-critical systems.

    Analyses from entities such as the Council on Foreign Relations and CSIS emphasize that even aggressive progress on these fronts is unlikely to obviate the need for significant HREE primary production over the coming decade. The main effect is to slightly flatten demand growth and to reallocate constrained HREE tonnages toward the highest-priority end uses.[2][4]

    6.3 Stockpiles, Lead Times, and Price Differentials

    In periods of heightened uncertainty—such as after MOFCOM’s 2025 licensing expansion and during intense phases of the Myanmar conflict—state and corporate actors have reportedly increased buffer stocks of key HREE oxides and metals. Policy analyses note that defense contractors, in particular, face lead times in the range of six to twelve months for compliant HREE oxides in some scenarios, especially where end-use scrutiny is tight.[2]

    Regional reports also indicate the emergence of price differentials between material sourced directly from Chinese processors and material routed via third countries such as Vietnam, where stockpiles are used to intermediate supply under different regulatory regimes, at premiums reportedly on the order of several tens of percent.[1][2] These differentials reflect not only transport and transaction costs but also the embedded regulatory and sanctions risk.

    Within this environment, Myanmar’s low-cost ionic clay output—variously described as achieving leaching costs in the few hundred dollars per MT of concentrate versus significantly higher costs in more regulated jurisdictions—remains structurally attractive for midstream processors.[5][7] However, that same cost advantage is tightly coupled to weak environmental controls and opaque governance.

    7. Synthesis: Trade-Offs and Conditions of Fragility

    Myanmar’s rare earth sector, particularly in Kachin State, has effectively become an externalised extraction arm of China’s HREE industrial base. Ionic clay geology, simple leaching flowsheets, and low regulatory overheads generate cheap feedstock that flows almost exclusively into Chinese SX and metal plants. China, in turn, wields unmatched separation capacity and a tightening export licensing framework.

    The core trade-offs are stark:

    • Cost vs. environmental and social risk: Low-cost ionic clay operations reduce upstream expenditure but embed significant environmental damage and social tension, raising the likelihood of future regulatory or reputational shocks.
    • Concentration vs. resilience: Concentrating mining in Kachin and processing in a few Chinese provinces enables economies of scale and process learning but amplifies the impact of any disruption, whether from conflict, natural disasters, or policy decisions.
    • Speed vs. governance: Rapid ramp-up of informal or semi-formal pits has boosted supply since 2017 but has outpaced the development of traceability, monitoring, and compliance systems.

    Industrial and policy responses—new projects in Vietnam and Australia, pilot processing hubs in Malaysia, recycling initiatives, and design-side HREE thrift—represent meaningful steps but do not yet rewire the basic architecture. For the remainder of the 2020s, most high-specification HREE demand is still likely to intersect, directly or indirectly, with Myanmar ionic clays and Chinese SX circuits.

    In this context, Myanmar’s civil war trajectories, KIA–junta ceasefire dynamics, MOFCOM licensing behaviour, and the evolution of environmental and labour standards in consuming markets become hard operational drivers rather than background noise. Small shifts in any of these domains can cascade into material changes in dysprosium, terbium, or erbium availability for magnets, optics, and other critical applications.

    For Ti22 Strategies, this chain is a textbook case where process engineering details, local political arrangements, and export licensing language interact to define system-level risk. Continuous monitoring of these weak signals—ranging from minor regulatory notices in Yunnan to localized protests in Kachin—will shape the next phase of Myanmar’s role in the HREE supply landscape.

    Note sur la méthodologie TI22 This assessment combines open-source policy documents (including MOFCOM announcements and US/EU critical minerals strategies), specialized market and production data (USGS, ISP-Myanmar, and cited industry research), and a close reading of technical specifications for downstream uses in magnets, batteries, and optics. Cross-referencing these layers enables a process-level view of where ionic clay mining, solvent extraction capacity, and export controls interact to create or alleviate systemic HREE supply risk.

    Sources

    • [1] S&P Global / Southeast Asia critical minerals coverage: “Commodities 2026: Southeast Asia Navigates Power Rivalry for Critical Minerals”.
    • [2] Council on Foreign Relations – “Leapfrogging China’s Critical Minerals Dominance”.
    • [3] Global Policy Watch – “Heavy Rare Earth Elements: Rising Supply Chain Risks and Emerging Policy Responses” (2026).
    • [4] CSIS – “Developing Rare Earth Processing Hubs: An Analytical Approach”.
    • [5] East Asia Forum – “Myanmar’s Rare Earth Gold Rush Is Fool’s Gold” (October 2025).
    • [6] Discovery Alert – “China Rare Earth Supply Domination 2026”.
    • [7] The Diplomat – “Inside China’s Rare Earth Empire: The Hidden Costs in Myanmar” (November 2025).
    • USGS National Minerals Information Center – “Rare Earths Statistics and Information” (2024 data).
    • Institute for Strategy and Policy–Myanmar – “Myanmar Rare Earth Exports 2024”.
    • Reuters – “China Rare Earth Export Licenses” (15 October 2025).
  • Us defense production act & critical minerals: what’s actually happening: Latest Developments and Analysis

    Us defense production act & critical minerals: what’s actually happening: Latest Developments and Analysis

    **US Defense Production Act (DPA) powers have shifted from an emergency tool for munitions to a structural instrument for rebuilding critical mineral supply chains. In practice, DPA funding and priority authorities are reshaping midstream rare earth and battery-material processing far more than greenfield mining, with execution constrained by permitting, technology risk, and contractor capacity rather than by legal authority on paper.**

    US Defense Production Act and Critical Minerals: What Is Actually Happening in the Industrial Base

    Executive context: Over the last decade, the US Defense Production Act (DPA) has quietly moved from the margins of industrial policy into the center of critical mineral strategy. The same statute once associated mainly with wartime steel and aircraft procurement is now embedded in rare earth separation projects, battery‑material refineries, and magnet plants that sit at the heart of modern defense and energy systems.

    Behind the headlines, the DPA operates through specific titles, appropriation channels, and contracting mechanisms that determine which parts of the critical minerals chain actually change. The reality as of late‑2024 is clear: DPA activity is materially reshaping midstream and downstream capacity for rare earths, lithium, cobalt, nickel, graphite, titanium, and tungsten, while leaving many upstream mining bottlenecks structurally intact. Understanding that split is essential for assessing feasibility, compliance exposure, and operational risk across projects that touch US or allied defense supply chains.

    1. Strategic context: why the DPA is now a critical minerals instrument

    The DPA was enacted in 1950 for a very different industrial landscape. Its core purpose was to ensure that, in a national emergency, the US government could prioritize and expand production of materials and goods essential to national defense. For decades, that meant traditional defense articles: munitions, aircraft, shipbuilding, electronics.

    The shift to critical minerals reflects a deeper change in what counts as “defense‑relevant.” Precision‑guided munitions, radar systems, electric platforms, hypersonic weapons, and secure communications now depend on rare earth magnets, high‑purity titanium, specialty alloys, and battery‑grade lithium, nickel, cobalt, and graphite. Meanwhile, production and processing of many of these inputs are highly concentrated in a small number of jurisdictions, above all China for rare earths, graphite, and certain minor metals.

    Public US policy documents and National Defense Strategy updates since 2018 have consistently framed this concentration as an industrial base vulnerability rather than just a trade exposure. That framing is what brings critical minerals under the legal umbrella of the DPA: the statute can be used wherever the Executive Branch determines that industrial capacity is essential for national defense and cannot be relied upon from commercial markets alone.

    The result is that activities that might once have been left to conventional industrial finance-rare earth separation, lithium conversion, magnet production, advanced anode and cathode materials-are increasingly treated as defense infrastructure. DPA funding, priority orders, and related instruments are the mechanisms that translate this shift in definition into concrete projects, procurement contracts, and stockpile changes.

    2. How the Defense Production Act actually operates for minerals

    On paper, the DPA is broad. In practice, only a subset of its titles have been heavily used for critical minerals so far: primarily Title I (priorities and allocations) and Title III (expansion of production capacity and supply). Title VII shapes coordination and information‑sharing but is less visible in plant‑level execution.

    2.1 Title I – Priorities and allocations

    Title I allows the US government to require firms to accept and prioritize contracts or orders for materials deemed necessary for national defense, ahead of commercial customers. In a minerals context, this means that a mine or refinery with limited output can be legally required to allocate a portion of production to fulfill government contracts first.

    As of 2024, there has been limited public use of outright allocation authority in mining and refining. Instead, the main operational impact lies in priority rating of defense‑linked contracts. For example, a rare earth magnet producer supplying guidance systems may receive priority‑rated orders that cascade upstream into priority demand for separated oxides or alloy feedstock. The technical consequence is that plant scheduling and inventory management must account for orders that cannot be delayed without violating DPA obligations, constraining flexibility to chase spot market premiums or opportunistic offtake.

    From a process standpoint, this influences how plants design redundancy and buffer capacity. A magnet facility that operates near nameplate throughput with tight maintenance windows faces a different compliance risk profile under Title I than a facility with more conservative utilization. Even without formal allocation orders, awareness that production might be reprioritized in a future crisis affects capital planning and logistics design.

    2.2 Title III – Expansion of productive capacity and supply

    Title III is where most visible critical mineral activity has occurred. Under this title, the government can provide financial assistance-typically grants, cost‑shares, or purchase commitments—to expand or maintain domestic (and, in some cases, allied) industrial capacity for materials and components essential to defense.

    For minerals, Title III actions have supported rare earth separation plants, metal and alloy production, permanent magnet manufacturing, and battery‑material refining facilities. According to Department of Defense announcements, multiple projects across rare earths and battery minerals have received DPA Title III funding since 2020, often structured as multi‑year contracts with specific milestones for engineering, construction, commissioning, and production ramp‑up.

    Operationally, Title III does not override environmental or safety regulation. A DPA‑backed rare earth refinery still must secure permits under the National Environmental Policy Act (NEPA), Clean Water Act, and relevant state mining and industrial statutes. This means that DPA funding can accelerate engineering, equipment procurement, and early works, but permitting, water rights, waste management design, and community engagement often remain the rate‑limiting steps.

    2.3 Stockpiling and the DPA interface

    The National Defense Stockpile (NDS), administered by the Defense Logistics Agency (DLA), operates under separate statutory authorities but is strategically coupled to the DPA. Stockpile acquisition plans for rare earths, titanium sponge, tungsten concentrates, and battery‑grade materials increasingly assume that DPA‑enabled projects will exist to supply material that meets defense specifications.

    From the perspective of a mine or refinery, this coupling is critical. A DPA Title III award may support capex for a separation or refining line, while NDS procurement contracts underpin offtake at specified purity and packaging standards. The combination can be the difference between a facility designed only for commercial grades (for example, mixed rare earth carbonate or technical‑grade lithium chemicals) and one capable of producing defense‑specification oxides, metals, or powders with tighter impurity controls and traceability.

    3. Where DPA has been applied across the minerals chain (through 2024)

    Looking across public disclosures up to late‑2024, three broad clusters of DPA‑linked activity in minerals are visible: rare earths and magnets; battery materials; and selected structural and specialty metals. Each cluster has different technical and execution dynamics.

    3.1 Rare earths and permanent magnets

    Rare earths have been an early and prominent use‑case for DPA Title III. Projects have targeted both separation (producing individual rare earth oxides from mixed concentrates) and downstream magnet production (NdFeB and, to a lesser extent, SmCo magnets) for defense and high‑reliability applications.

    Typical DPA‑backed flowsheets for light rare earths (La-Nd, sometimes Pr) involve beneficiation of ore to concentrate, calcination or roasting, acid leaching (often using hydrochloric or sulfuric acid), impurity removal, and multi‑stage solvent extraction (SX) to produce separated oxides. For heavy rare earths (Dy–Tb and beyond), some projects leverage by‑product streams from existing operations or alternative feedstocks, with SX or ion exchange used for fine separation steps.

    On the magnet side, DPA‑linked projects generally include alloy production (melting and strip casting), powder production (hydrogen decrepitation, jet milling), pressing and sintering or bonded magnet routes, and precision machining with tight dimensional tolerances. Environmental controls around dust management, hydrogen handling, and rare earth oxide particulates are non‑trivial, especially where defense‑spec cleanliness and documentation are required.

    Illustration of the critical minerals supply chain supporting U.S. defense production.
    Illustration of the critical minerals supply chain supporting U.S. defense production.

    The notable pattern is that DPA has focused far more on midstream separation and magnet capacity than on greenfield rare earth mining. Existing mines or advanced projects supply concentrates, while DPA resources target the parts of the chain where China’s dominance is most acute and where relatively modest capacity can unlock disproportionate system resilience.

    3.2 Battery materials: lithium, nickel, cobalt, graphite, manganese

    In 2022, the White House issued determinations bringing several battery‑related minerals—lithium, nickel, cobalt, graphite, and manganese—under DPA national defense priorities. Since then, DPA‑related funding and contracting activity has backed projects ranging from lithium chemical conversion to graphite anode materials and high‑purity manganese sulfate production.

    These projects typically sit in the refining and active material stages. For lithium, this can involve conversion of spodumene concentrates or brines into lithium carbonate or hydroxide suitable for battery‑grade LCE products. Critical process stages include calcination (for hard‑rock), acid or alkaline digestion, impurity precipitation, solvent extraction or ion exchange polishing, and crystallization. Each stage has strong energy, water, and reagent footprints; DPA support often targets equipment and process integration rather than fundamentally new chemistries.

    For graphite, DPA‑linked initiatives have focused on synthetic and natural graphite processing into anode‑ready materials. Unit operations include high‑temperature graphitization, shaping and classification, carbon coating, and binder integration. These are thermal and electricity‑intensive steps, sensitive to power pricing, emissions constraints, and local air quality regulation. DPA funding can underwrite high‑temperature furnaces, environmental control systems, and process control infrastructure that might otherwise struggle to pass internal hurdle thresholds under conventional capital discipline.

    3.3 Structural and specialty metals: titanium, tungsten and beyond

    Titanium and tungsten have long histories in defense applications but have recently reemerged in policy language as part of broader critical mineral concerns. DPA tools have been used intermittently to support titanium sponge and alloy production capacity, as well as tungsten powder and carbide supply chains linked to munitions and hard‑metal components.

    These segments tend to be less visible in public DPA announcements than rare earths or batteries, but they share similar dynamics: the challenge is often not basic mining, but stable access to intermediate forms—titanium sponge, high‑purity ferro‑tungsten, fine tungsten powders—that meet tight aerospace and munitions specifications. DPA projects in this space commonly focus on modernizing older facilities, replacing legacy furnaces or reduction reactors, and improving product consistency through better process control and analytical instrumentation.

    4. Technical and operational consequences for mining, refining, and magnet projects

    The most important insight from several years of DPA application to minerals is that the statute does not erase engineering and operational constraints; it reshapes where they matter most. Capital may become less scarce, but process risk, permitting timelines, workforce availability, and technology selection remain decisive.

    4.1 Technology choice: proven flowsheets vs new processes

    DPA‑backed projects in rare earths and battery materials cluster around two ends of a spectrum. On one end are facilities based on conventional, well‑understood flowsheets: multi‑stage SX for rare earth separation; sulfuric acid leaching and neutralization for laterite nickel; traditional calcination and hydrometallurgy for spodumene. On the other end are projects seeking to commercialize newer approaches such as advanced ion exchange systems, membrane‑based separations, or direct lithium extraction (DLE) from unconventional brines.

    Because DPA’s statutory mission is industrial base reliability, project selection tends to favor technologies with demonstrated pilot performance and clear pathways to defense‑grade product specifications. Novel processes are not excluded, but the bar for evidence—continuous pilot data, impurity profiles, reagent recycling performance, by‑product management—is high. A plant relying on an unproven DLE technology with uncertain long‑term sorbent performance or scaling behavior faces a very different risk profile than a plant extending an established sulfate leach and SX train, even if both are nominally “DPA‑backed.”

    This leads to a subtle but important effect: DPA can accelerate the deployment of incremental innovations (better solvent systems, improved resins, more efficient kilns) more readily than it can underwrite highly speculative process revolutions. After extended monitoring of project announcements and technical disclosures, one pattern stands out: the statute is reshaping the geography of conventional processing capacity more than it is changing the underlying chemistry of extraction and separation.

    4.2 Energy, water, and waste as design constraints

    Rare earth separation, lithium refining, and high‑temperature graphite processing share a common reality: they are resource‑intensive. Energy use is measured in significant kWh per tonne of product; water intensity and reagent consumption are non‑trivial; and waste streams—acidic liquors, neutralized sludges, red muds, calcined tailings—must be managed under increasingly tight environmental standards.

    DPA funding does not exempt facilities from state air and water permits or from federal hazardous waste rules. Instead, it often requires additional environmental and reporting covenants. Projects backed by Title III contracts frequently incorporate enhanced effluent treatment, tailings management systems with higher factors of safety, and more sophisticated emissions abatement (for example, for HF, SO2, or NOx) than early conceptual designs envisioned.

    A critical minerals mine reflecting the upstream challenges in securing supply.
    A critical minerals mine reflecting the upstream challenges in securing supply.

    This matters for capex and opex drivers. A rare earth SX plant designed for defense‑grade oxides with strict impurity limits typically requires more extraction stages, tighter control of organic/aqueous phase ratios, more extensive analytical QA/QC, and more robust solvent regeneration systems than a plant optimized for generic commercial mixed oxides. Each of these additions carries energy and reagent penalties. Title III money can offset the capital burden of installing this equipment, but operating costs remain with the plant operator over the facility’s life.

    4.3 Workforce, commissioning, and ramp‑up risk

    Rare earth separation, hydrometallurgical refining, and high‑spec metal/alloy production are skills‑intensive activities. Many DPA‑backed projects in North America and allied countries are being executed in regions without deep prior experience in these exact processes, especially when compared with Chinese industrial hubs that have accumulated decades of tacit knowledge.

    Commissioning risk shows up in longer‑than‑expected ramp‑up curves, off‑spec product, and higher reagent consumption during early operations. To mitigate this, Title III contracts often include explicit milestones tied not just to mechanical completion but to sustained production at target specifications. This alignment of incentives can reduce the risk of partially completed “showpiece” plants, but it cannot fully compensate for gaps in operator experience, local supply chain depth (for spare parts, specialty chemicals, analytical services), and regional power and water reliability.

    A striking realization from tracking several rare earth and battery‑material builds is that DPA primarily derisks the financial aspect of early capacity build‑out; it does not derisk the practical art of running a complex hydrometallurgical or powder metallurgy operation day after day. That residual gap is where many projects will ultimately succeed or fail.

    5. DPA versus other industrial tools: where it fits

    The US policy toolkit for critical minerals now includes the DPA, Department of Energy (DOE) loan and grant programs, tax credits under recent legislation, export finance, and state‑level incentives. Each tool targets different failure modes in the market.

    DOE’s Loan Programs Office typically focuses on large‑scale energy transition projects with the ability to service debt from future cash flows, often emphasizing climate impact and innovation. Tax incentives under recent laws favor projects that can quickly reach taxable income and that fit defined technology categories. Export‑import finance and development finance target cross‑border projects aligned with broader geopolitical objectives.

    By contrast, the DPA is narrower in mission—national defense—and more flexible in structure. Title III funding can cover early engineering, equipment procurement, and construction even when future cash flows are uncertain or when product will initially be sold under specialized defense contracts rather than broad commodity markets. It is particularly well suited to “orphan” midstream assets—separation plants, alloy facilities, magnet lines—that are strategically necessary but commercially thin.

    However, the statute depends on annual or multi‑year appropriations and political prioritization. This means that DPA use can be episodic and subject to shifts in focus (for example, from rare earths toward batteries or from one family of metals to another). For industrial planners, this variability translates into execution risk: a plant designed around a one‑time Title III build grant still needs a long‑term cost structure that is competitive without recurring public infusions.

    6. Risk, compliance, and execution constraints that outlast the statute

    DPA involvement changes a project’s regulatory and contractual perimeter. It also introduces new points of failure. Several categories of risk are particularly material for critical mineral projects linked to defense supply chains.

    6.1 Environmental and social license

    Rare earth separation and battery‑material refining carry legacies of environmental damage in multiple jurisdictions. As a result, public scrutiny of new projects—especially those with explicit government backing—is intense. NEPA processes, state environmental reviews, and in some cases indigenous consultation frameworks can extend timelines and impose design changes that alter project economics.

    DPA support does not override these requirements; if anything, it raises expectations. A project receiving Title III funds is more likely to be challenged on its environmental impact statement, water use, or waste storage design. Tailings dam configurations, brine reinjection plans, and off‑gas treatment systems become not only engineering decisions but political ones. An environmental incident at a DPA‑backed facility would have outsized reputational and policy consequences, which is one reason why technical conservatism tends to dominate flowsheet selection in these programs.

    6.2 Foreign ownership, offtake, and technology control

    Given the statute’s national defense focus, DPA‑linked contracts typically contain provisions related to foreign ownership, control, and influence. The Committee on Foreign Investment in the United States (CFIUS) and related mechanisms scrutinize equity participation, board representation, and offtake agreements with entities from countries designated as posing strategic concerns.

    For rare earth and battery‑material projects, this often interacts with reality on the ground: process know‑how, critical equipment, and offtake chains are frequently global. Facilities seeking DPA support while maintaining technology partnerships or offtake with major Asian processing or trading firms must navigate complex contractual structures to satisfy both commercial requirements and security‑driven restrictions on data, product flows, and intellectual property.

    An underappreciated risk is that constraints on offtake flexibility can reduce a plant’s ability to balance defense‑linked orders with broader market participation. A facility heavily tied to defense procurement, with limits on sales to higher‑margin commercial buyers, may face tension between industrial base resilience objectives and internal financial performance targets.

    6.3 Contracting, reporting, and cyber requirements

    Title III agreements are not conventional commercial supply contracts. They often incorporate Federal Acquisition Regulation (FAR) and Defense FAR Supplement (DFARS) clauses, cybersecurity requirements, domestic preference rules, and detailed reporting obligations on cost, schedule, subcontracting, and data management.

    Conceptual graphic showing the connection between U.S. policy and critical mineral security.
    Conceptual graphic showing the connection between U.S. policy and critical mineral security.

    On the plant floor, this translates into additional systems: secure data environments for process control and quality records, audit‑ready maintenance and calibration logs, traceability for batches of ore, intermediates, and final products, and sometimes restrictions on using foreign‑supplied control software or network equipment. These overlays affect staffing, IT architecture, and vendor selection. They also create new failure points: a cybersecurity non‑compliance incident or misreported milestone can jeopardize funding even if the physical plant is progressing to plan.

    After tracking multiple DPA‑linked projects, a recurring pattern emerges: DPA funding moves front‑end capital risk from private balance sheets to the public ledger, but process risk and compliance risk remain fully in the operator’s domain. Managing those two risks in parallel is often more challenging than closing the initial funding gap.

    7. International dimension: allied supply chains and competing policy models

    DPA authorities traditionally focused on domestic industry, but critical minerals supply chains do not respect national borders. Recent years have seen the statute applied in ways that support allied industrial capacity as well, particularly where facilities in partner countries are tightly coupled to US defense programs or where they supply unique processing stages not yet available domestically.

    Australian‑linked rare earth separation in the United States, North American magnet production involving Japanese and European technology providers, and joint processing initiatives with Canadian miners illustrate how DPA tools integrate with allied capabilities. Parallel frameworks such as the Minerals Security Partnership (MSP) and bilateral critical minerals agreements with countries like Australia and Canada provide diplomatic and regulatory scaffolding around these projects.

    At the same time, competing policy models shape the playing field. China’s Ministry of Commerce (MOFCOM) export controls on gallium, germanium, and certain rare earth technologies, along with licensing requirements for specific processing technologies, highlight a different approach centered on export leverage and technology control. The European Union’s Critical Raw Materials Act adds yet another model, emphasizing diversified sourcing and environmental standards.

    In this environment, the DPA functions less as a standalone instrument and more as one node in a network of industrial policies across jurisdictions. For project developers and operators, this means that rare earth or battery‑material plants may simultaneously respond to DPA‑driven defense requirements, EU environmental norms, and Asian customer specifications, all while navigating export controls and sanctions regimes that evolve over time.

    8. Forward‑looking industrial scenarios and trade‑offs (to late‑2024)

    Without speculating beyond publicly available information through late‑2024, it is possible to delineate several structural paths for how DPA use in minerals could evolve, each with distinct implications for technology choices, plant design, and operational risk.

    One path emphasizes DPA as a targeted gap‑filler. Under this model, the statute continues to focus on specific bottlenecks—heavy rare earth separation, high‑coercivity magnet production, battery‑grade graphite—that are unlikely to be financed at scale by commercial markets alone. The emphasis remains on midstream processing and defense‑linked downstream components, with relatively limited involvement in new mine development. Technical risk under this path centers on scaling conventional flowsheets in new geographies while meeting tighter environmental and quality standards.

    A second path envisages more systemic DPA involvement across the chain, including upstream. This would imply DPA support for mining projects where orebody characteristics (grade, mineralogy, impurity suite) are well understood but capital and offtake remain uncertain due to geopolitical or ESG headwinds. In that scenario, DPA would be pulled closer to geotechnical risk, resource modeling uncertainty, and mine closure liabilities, rather than mainly processing‑plant risk. The skill sets and timelines involved would be very different from the Title III projects seen to date.

    A third path treats DPA primarily as an emergency tool, with limited peacetime deployment but strong readiness to issue priority orders and allocate production in a crisis. Here, the statute’s impact depends less on annual funding levels and more on how much fungible, dual‑use capacity exists in allied systems. Plants capable of switching between commercial and defense‑grade production, or between different rare earth or battery‑material product slates, would be central to this model. The key design variable becomes flexibility, not just nameplate throughput.

    Across all paths, one constant trade‑off stands out: speed versus robustness. Accelerated project timelines enabled by DPA can bring critical capacity online sooner, but they leave less time for iterative optimization of flowsheets, piloting of impurity removal strategies, and development of local workforce expertise. Conversely, more cautious, multi‑stage deployment reduces early capacity but can improve long‑term plant performance and environmental outcomes. DPA interventions sit at the center of this tension, and the institutional appetite for risk will largely determine where the balance lands.

    9. Conclusion: what actually matters in DPA‑backed minerals projects

    As of late‑2024, the practical record of the Defense Production Act in critical minerals is neither a panacea nor a footnote. It has demonstrably accelerated midstream rare earth and battery‑material capacity, enabled magnet and alloy projects that would have struggled under conventional financing alone, and signaled that certain materials are now regarded as part of defense infrastructure rather than just industrial commodities.

    At the same time, the statute has not eliminated the structural constraints that define mining and processing projects. Orebody quality, flowsheet robustness, permitting timelines, energy and water availability, and workforce depth continue to dominate operational risk. DPA funding can change who bears early capital risk and how quickly plants are built, but it does not change the thermodynamics of leaching, the chemistry of solvent extraction, or the realities of managing tailings and emissions over decades.

    For critical minerals, the most accurate way to think about the DPA is as a mechanism that rebalances where risk sits in the system. Financial and offtake risk for strategically significant processing capacity moves toward the public sector; process, environmental, and compliance risk remain with operators and their supply chains. After careful review of projects to date, one insight is particularly quotable: the DPA changes who pays for the plant, but not who lives with the flowsheet.

    Note sur la méthodologie TI22 TI22’s analysis of DPA and critical minerals triangulates public US policy documents (including DPA determinations and National Defense Stockpile plans), allied and competitor measures (such as MOFCOM export controls and EU critical raw materials frameworks), and the technical specification demands of downstream defense and energy systems. This cross‑reading of legal texts, industrial data, and process‑level requirements underpins a continuous horizon scan of where policy signals intersect with real‑world metallurgical and mining constraints.

    Within this framework, the distinctiveness of the Ti22 Strategies approach lies in connecting legal authority and budget lines to concrete engineering and operational decisions across exploration, beneficiation, refining, and advanced material production. The focus remains on how statutory tools like the DPA alter the configuration of technical options, procurement relationships, and compliance obligations in the real industrial base. This analysis is therefore paired with active monitoring of weak policy, technical, and market signals that will define the next phase of DPA‑linked critical minerals development.

    Sources

  • Ndfeb magnets: the supply chain that powers the energy transition: Latest Developments and Analysis

    Ndfeb magnets: the supply chain that powers the energy transition: Latest Developments and Analysis

    **NdFeB magnets sit at the core of EV traction motors and direct‑drive wind turbines, but from 2024-2026 the mine‑to‑motor chain is defined less by geology than by processing and alloy bottlenecks. Heavy rare earth separation (Dy/Tb), ferroboron availability, and an overwhelmingly China‑centric magnet manufacturing base are setting the practical ceiling on how fast the energy and defense sectors can de‑risk supply.**

    NdFeB Magnets: The 2026 Supply Chain Behind the Energy Transition

    Neodymium‑iron‑boron (NdFeB) magnets have become the quiet infrastructure of the energy transition. High‑performance permanent magnets underpin traction motors in electric vehicles (EVs) and direct‑drive generators in wind turbines, with industry studies such as Future Markets [1] projecting that demand for NdFeB‑related rare earth oxides could roughly triple by 2035. The constraint in 2026 is not only ore availability, but the technical and geopolitical fragility of the mid‑stream: separation of heavy rare earths, ferroboron production, and magnet manufacturing concentrated overwhelmingly in China.

    From an operational perspective, this chain is unforgiving. A traction motor typically embeds around 1.2-3.8 kg of NdFeB magnets per EV, while an offshore direct‑drive wind turbine can use in the order of 600-800 kg of magnet material per megawatt of capacity [1]. Any disruption upstream of magnet block supply propagates rapidly into assembly plants and project schedules. The 2025 Chinese export licence regime for dysprosium (Dy), terbium (Tb) and related products, combined with still‑nascent ex‑China separation and recycling capacity, has turned what was once a pricing problem into a structural availability issue.

    The analysis below follows the NdFeB chain end‑to‑end-from ore to motor-and focuses on where the system is actually binding between 2024 and 2026. The emphasis is on industrial feasibility, process constraints and operational risk, using concrete project examples in jurisdictions prioritising “friend‑shoring” (United States, Australia, Europe, UK) and the regulatory regimes reshaping how material can move across borders.

    1. Technical Backbone: From Ore to NdFeB Motor

    NdFeB magnets are, chemically, a relatively simple alloy family. Industrial compositions cluster around Nd2Fe14B, modified with praseodymium (Pr) and small additions of Dy or Tb to maintain coercivity at elevated temperatures. Technically, however, every kilogram of magnet embodies a long chain of extraction and processing steps: mining and concentration of rare‑earth‑bearing minerals, chemical cracking and separation, conversion to metals and alloys (including ferroboron), powder metallurgy, sintering, machining, coating and final motor integration.

    Upstream, bastnäsite and monazite remain core feedstocks. These minerals carry light rare earth elements (LREEs) such as neodymium and praseodymium, and often minor quantities of heavy rare earth elements (HREEs) including dysprosium and terbium. Deposits such as Mt Weld (Australia), Mountain Pass (USA) and monazite streams at mineral sands operations provide the geological basis for the chain [1][5][6]. Ore is mined, milled and concentrated into a rare earth mineral concentrate before undergoing “cracking” via acid or caustic roasting and leaching.

    The critical mid‑stream step is solvent extraction (SX) separation. Here, multi‑stage mixer–settler banks partition the light and heavy rare earths through thousands of equilibrium stages. Dy and Tb have very similar chemical behaviour to adjacent rare earths, making high‑purity separation slow, energy‑ and reagent‑intensive. Industry reporting cited by S&P Global [5] and others indicates that >90% of global rare earth separation capacity-including essentially all large‑scale heavy rare earth separation—is located in China, with only two meaningful heavy‑rare‑earth‑capable plants outside China (in Malaysia and Estonia) [2][6].

    Once separated, rare earth oxides are converted to metals (e.g., Nd metal) and then alloyed. NdFeB magnet alloy production typically uses vacuum induction melting and strip casting to form thin flakes with controlled microstructure, followed by hydrogen decrepitation (HD) and jet milling to create fine, anisotropic powder. This powder is then aligned in a magnetic field, pressed, sintered, heat‑treated, machined and coated (often with multi‑layer Ni–Cu–Ni and epoxy) to manage corrosion and mechanical robustness.

    Ferroboron is a less visible but equally critical node. In industrial practice, boron is frequently introduced as a ferroalloy—ferroboron—rather than pure boron metal. Projects such as 5E Advanced Materials’ Fort Cady in California aim to produce ferroboron from boric acid feedstock, targeting around 5,000 metric tonnes (MT) per year in the longer term under a pilot starting in 2026 [3]. The United States Geological Survey has flagged that the US currently has no domestic ferroboron production and relies on imports [3], creating a distinct vulnerability even when rare earth supply is otherwise secured.

    Downstream, magnet blocks are incorporated into interior permanent magnet (IPM) traction motors, generators and a wide range of aerospace and industrial applications. For high‑temperature duty—such as rotor magnets in EVs or high‑speed aerospace actuators—Dy and Tb additions are used to maintain coercivity and prevent demagnetisation. Grain boundary diffusion processes can reduce heavy rare earth content per kilogram of magnet, but cannot yet fully eliminate Dy/Tb demand without sacrificing performance for many demanding drive cycles.

    2. Bottlenecks 2024–2026: Where the Chain Is Binding

    The NdFeB chain is often depicted as a linear flow from mine to motor. In practice, it behaves more like a set of coupled bottlenecks. For 2024–2026, four constraints dominate: heavy rare earth separation, ferroboron production, magnet manufacturing concentration, and a recycling base too small to materially offset primary supply shocks.

    Stage China Share (2026 est.) Critical Bottleneck Operational Impact by 2026
    Mining ~60–70% REO production [5] Limited heavy rare earth (Dy/Tb) outside China Structural deficit for high‑temperature NdFeB magnets [5]
    Separation & Refining >90% [2][5] Heavy rare earth separation monopoly; only two significant ex‑China heavies plants Chinese export licences reported to affect c. 15% of Japanese magnet production [2][5]
    Alloy (Ferroboron) US 100% import reliance [3] No US ferroboron production Latent risk for EV and defense alloy supply [3]
    NdFeB Magnet Manufacturing ~92% [1][5] Manufacturing and technology clustered in China Downstream bottlenecks for aerospace, EVs and electronics during restrictions [2][5]
    Recycling <1% of supply [1][2] Limited scrap processing and collection Early‑stage relief; potential ~10% contribution by 2036 [1][2]
    Motor Integration Diversified geographically Dependence on magnet block availability and qualification Documented plant slowdowns and closures (e.g., Ford facility in 2025) [2][5]

    Several themes stand out. First, Dy and Tb separation capacity is tightly concentrated. S&P Global [5] and EU sources [6] consistently frame heavy rare earth processing—rather than mining—as the principal bottleneck for high‑temperature magnet material. Even where projects such as Northern Minerals’ Browns Range can supply heavy rare earth concentrate, the actual conversion to separated Dy/Tb oxides or metals often still depends on Chinese SX capacity or small ex‑China plants operating near their technical limits.

    Second, China’s December 2025 export licence regime for Dy, Tb, yttrium (Y) and lutetium (Lu), as well as certain NdFeB‑related products, has system‑wide effects. Industry reporting [2][5] indicates that licences are now required not only for direct exports, but also for some products manufactured outside China that incorporate Chinese‑origin heavy rare earths, with a six‑month transition period. Exemptions exist for very low content (reported at less than 0.1% in the input data), but many traction and wind magnets fall well above such thresholds. Sources cited in the draft article point to heavy rare earth price premiums of roughly one‑quarter emerging post‑implementation, and cases where Japanese magnet plants reliant on Chinese feedstock have experienced material disruptions [2][5].

    Third, ferroboron has shifted from a commodity alloy to a critical node. With the US at 100% import dependence for ferroboron and USGS explicitly highlighting the absence of domestic production [3], alloy plants producing NdFeB feedstock remain exposed even if Nd/Pr supply is diversified. The 5E Advanced Materials Fort Cady project, which targets around 5,000 MT per year of ferroboron after a pilot phase commencing 2026 [3], is emblematic: progress there directly affects the feasibility of a mine‑to‑magnet chain that does not loop back to overseas ferroboron suppliers.

    Finally, magnet manufacturing remains heavily China‑centric. Estimates collated in [1] and [5] place China’s share of NdFeB magnet production around 92%, with more than 90% of processing capacity. Even when rare earth oxides or metals are sourced from Australia or the US, many magnet designs still go through Chinese grinding, sintering and finishing facilities. The Ford plant closure in Chicago in 2025, referenced in [2][5], highlights how quickly downstream automotive operations react to supply uncertainty at the magnet stage.

    3. Project‑Level Nodes: 12 Critical Installations for 2026

    Mapping the mine‑to‑motor chain against specific projects reveals where incremental tonnes actually translate into reduced system fragility. The draft input classifies 12 projects and plants into three tiers based on 2026 relevance: Tier 1 for immediate bottlenecks (especially separation and heavy rare earths), Tier 2 for alloy and magnet capacity, and Tier 3 for recycling and European autonomy. Capacities and timelines below derive from the sources cited [1][3][4][5][6][7][8].

    Diagramme de la chaîne d’approvisionnement des aimants NdFeB, de la mine au moteur électrique et à l’éolienne offshore.
    Diagramme de la chaîne d’approvisionnement des aimants NdFeB, de la mine au moteur électrique et à l’éolienne offshore.

    Tier 1 – Immediate Bottlenecks: NdPr and Heavy Rare Earth Supply

    Lynas Rare Earths – Mt Weld & Kalgoorlie (Western Australia)
    Mt Weld is one of the highest‑grade rare earth deposits globally. Lynas’ operations, combined with its Kalgoorlie processing hub, are reported in the input as having capacity around 7,000 MT per year of rare earth oxides (REO) focused on NdPr, with an expansion pathway towards approximately 10,500 MT per year by end‑2026 [1][5]. Industry commentary in [1] suggests Lynas supplies in the order of 15% of ex‑China NdPr for traction motors and offshore wind. Operationally, Mt Weld and Kalgoorlie face conventional mining and processing challenges—port congestion at Fremantle, Australian environmental scrutiny of radioactive residues—but their strategic function is clear: they form one of the few large, integrated, non‑Chinese NdPr supply nodes.

    MP Materials – Mountain Pass (California, USA)
    Mountain Pass is currently the only significant US rare earth mine. The input cites capacity of around 40,000 MT per year of REO production from bastnäsite, with a Phase 2 separation project targeting roughly 6,000 MT per year of NdPr by late 2025 [1][7]. Reported 2025 production of around 45,000 MT REO [1] and a supply arrangement with General Motors for ~1,000 MT per year of NdFeB alloy underscore Mountain Pass’s role in enabling US‑based magnet and motor production. At the same time, MP remains constrained by external Dy/Tb supply and US permitting timelines, including Environmental Protection Agency (EPA) processes highlighted in the draft as a risk factor for 2026.

    Northern Minerals – Browns Range (Western Australia)
    Browns Range, in the Tanami region, is one of the few heavy rare earth‑focused projects outside China. The draft notes a planned capacity of around 1,500 MT per year of Dy/Tb‑equivalent output, with first production targeted for the second half of 2026 [1]. A pilot separation plant around 500 MT per year is referenced (Crackshot lode: 4.2 Mt at 0.61% TREO) [1]. The strategic role is straightforward: Browns Range provides Dy/Tb feedstock for high‑temperature NdFeB used in offshore wind, aerospace and high‑load EV motors. The challenges are equally clear—CAPEX inflation reported at ~30%, and opposition from some Indigenous stakeholders, which can affect timelines and social licence.

    Iluka – Eneabba (Western Australia)
    Eneabba reprocesses monazite‑rich mineral sands to generate rare earth‑bearing feedstock. According to [6] and the draft, it processes around 10,000 tonnes per year of monazite, with a rare earth capacity framed at around 300 MT per year of monazite‑derived rare earth content in early phases, ramping through 2026. As a producer of NdPr and some heavies, Eneabba is listed by Australia as a critical mineral project [6]. Technically, the main constraints are management of thorium‑bearing residues and logistics to Fremantle via rail, both of which add regulatory and operational complexity but also create a template for other monazite‑based projects.

    Tier 2 – Alloy and Magnet Capacity: Ferroboron and Mine‑to‑Magnet Integration

    5E Advanced Materials – Fort Cady (California, USA)
    Fort Cady is primarily a boron resource, but its strategic role is centred on ferroboron. Morningstar‑linked reporting [3] and the draft describe a target of around 5,000 MT per year of ferroboron, with pilot‑scale operations envisaged by 2026. This directly addresses the USGS‑identified gap in US ferroboron production [3]. From a process standpoint, Fort Cady’s task is to convert boric acid streams into a consistent ferroboron alloy that meets tight impurity and composition tolerances for NdFeB producers, while integrating into broader mine‑to‑magnet initiatives in North America.

    USA Rare Earth – Round Top (Texas, USA) and Magnet Plant (Oklahoma)
    USA Rare Earth’s Round Top project is positioned as a full mine‑to‑magnet chain in the US. The input cites a projected 2,000 MT per year of NdFeB magnet capacity at Round Top‑linked facilities, alongside a resource base of around 1.6 billion tonnes and a Stillwater plant in Oklahoma slated for up to 4,000 MT per year of magnets [7]. The strategic ambition is to close the loop from rare earth mining through separation to finished magnets for defense and industrial applications. Heavy rare earth grades are variable, according to the draft, adding geological risk. On the processing side, establishing repeatable powder metallurgy and sintering quality at this scale, in a region without an established NdFeB labour and supply ecosystem, is a non‑trivial challenge.

    Phoenix Tailings (Massachusetts, USA)
    Phoenix Tailings embodies the recycling and “zero‑waste” end of the mid‑stream innovation spectrum. The company is reported in [2][7] as operating around 200 MT per year of recycled NdFeB‑related rare earths, with a scale‑up target of ~500 MT by 2026, supported by around $10 million in US Department of Energy (DOE) funding. The technical core is a plasma‑based process that claims to process magnet scrap with minimal waste. Operationally, the limit is not only technology scale‑up, but feedstock: sufficient volumes of clean, segregated magnet scrap with known composition, along with the qualification of recycled material for defense and automotive applications.

    Tier 3 – Recycling and European Autonomy

    HyProMag – Tyseley Energy Park (Birmingham, UK)
    HyProMag’s Tyseley plant is one of the first commercial demonstrations of Hydrogen Processing of Magnet Scrap (HPMS) in Europe. The project is described in [4] as targeting around 300 MT per year of NdFeB blocks from scrap by 2026, following a 50 MT pilot in 2025. HPMS uses hydrogen to embrittle and decrepitate magnets directly from scrap motors and hard disk drives, preserving the alloy chemistry and magnetic alignment where possible. The practical constraints are hydrogen handling, contamination control and EU regulatory constraints on importing magnet scrap, including from China, within the framework of the EU Critical Raw Materials (CRM) Act [4][6].

    Carester – Estonia
    Carester operates rare earth separation facilities in Estonia, one of the very few heavy rare earth separation capacities outside China. The draft cites around 500 MT per year of rare earth separation capacity focused on heavies, with expansion through 2026 [2][6]. Strategically, Carester’s operations are tied to European efforts to build at least 10% domestic extraction and 40% processing of critical raw materials by 2030 under the CRM Act [6]. The plant’s feedstock, however, is still partly linked to Chinese or Chinese‑influenced streams, and is so exposed to the same dual‑use export controls that affect magnet producers in Japan or the EU.

    Globe Metals & Mining – Kanyika/Associated Projects (Australia/Mozambique)
    Globe Metals & Mining’s portfolio includes niobium‑tantalum and rare earth‑containing projects, with the draft indicating around 1,000 MT per year of magnet‑relevant rare earth output under development and qualification for 2026 [5][8]. The co‑production of niobium and tantalum makes these projects relevant for defense and advanced electronics. The CEO is cited in [5] as emphasising refining as the principal bottleneck: without additional separation and refining capacity for heavies, new mine output cannot fully translate into magnet‑grade feedstock. Logistics from African sites and regulatory stability add further layers of execution risk.

    Vue d’ensemble d’une mine moderne de terres rares, illustrant l’extraction des éléments critiques pour les aimants NdFeB.
    Vue d’ensemble d’une mine moderne de terres rares, illustrant l’extraction des éléments critiques pour les aimants NdFeB.

    Peninsula (Pilbara, Australia)
    Peninsula’s high‑grade monazite project in the Pilbara is positioned in the draft as an advanced exploration asset targeting around 2,500 MT per year of REO, with first production indicated for 2027 but offtakes and contracts already under discussion for 2026 [1]. The main operational constraint is water management in a desert environment, which affects both mining and chemical processing. Geopolitical risk is comparatively low, but processing risk remains: as with other monazite projects, thorium and radionuclide management must meet stringent Australian regulatory standards.

    Energy Fuels – White Mesa (Utah, USA)
    White Mesa is primarily a uranium mill that has increasingly shifted into rare earth processing. The input cites a capacity of around 1,000 MT per year of NdPr by 2026, supported by approximately $134 million in DOE funding across the US rare earth chain [7]. White Mesa’s co‑production model leverages existing uranium circuits to crack and process rare earth‑bearing feeds. The flip side is regulatory intensity: Nuclear Regulatory Commission (NRC) oversight, coupled with community scrutiny of radioactive waste, creates a complex permitting and compliance environment. From a resilience perspective, however, co‑processing uranium and rare earths provides a way to amortise infrastructure and maintain operating continuity under multiple commodity price regimes.

    4. Process Risk and Operational Failure Modes

    Looking across these projects, risk clusters as much around process engineering as around geology. Separation plants face scaling and environmental challenges, alloy and magnet plants grapple with microstructure control and impurity management, and recyclers battle feedstock heterogeneity and regulation.

    Separation and refining. Solvent extraction circuits for rare earths can involve hundreds to thousands of mixer–settler stages, with tight temperature, pH and phase‑ratio control. Deviations cause cross‑contamination between adjacent rare earths, lowering product purity and increasing the need for re‑processing. Heavy rare earth circuits are particularly sensitive, as separation factors between Dy, Tb and their neighbours are small. Effluent streams often contain sulphate, nitrate and chloride species alongside radionuclides from monazite or other thorium‑bearing minerals, which require robust tailings and water treatment systems. Projects such as Eneabba and White Mesa therefore combine process control risk with regulatory scrutiny over radioactive waste streams.

    Alloy and sintered magnet production. NdFeB alloy production hinges on repeated thermal and mechanical steps that define grain size, orientation and boundary chemistry. Strip casting, hydrogen decrepitation, jet milling and sintering all influence coercivity, remanence and mechanical integrity. Failure modes include abnormal grain growth, oxygen or carbon contamination from process gases and tooling, and non‑uniform Dy/Tb distribution leading to local demagnetisation at elevated temperature. Once a plant has qualified a recipe for a specific automotive or aerospace platform, even small process changes can trigger lengthy re‑qualification cycles.

    Recycling technologies. HPMS, as deployed by HyProMag, uses hydrogen to expand and crack sintered magnets in situ. This preserves much of the anisotropy and composition, allowing direct re‑use in some cases. However, hydrogen handling introduces explosion and embrittlement risks, and scrap streams frequently carry coatings, adhesives and mechanical damage that complicate processing. Plasma‑based methods such as those developed by Phoenix Tailings offer the potential for broader feedstock tolerance but must still deal with slag chemistry, off‑gas treatment and reproducible separation of rare earths from iron and other alloying elements. Across both approaches, one structural limitation dominates 2024–2026: the quantity and quality of available scrap, particularly from end‑of‑life EVs that are only now beginning to reach dismantling volumes [2][4].

    These technical risks translate directly into industrial continuity questions. A separation plant excursion can temporarily reduce product purity below magnet‑grade specifications. An alloy furnace or sintering line deviation can produce entire batches of magnets that fail downstream qualification tests, delaying EV or wind turbine production by months. This is why project‑level capacity additions in tonnes per year tell only part of the story; the rest lies in process stability and qualification track record.

    5. Regulation, Geopolitics and Industrial Resilience (2024–2026)

    Regulatory and geopolitical developments between 2024 and 2026 are reshaping how NdFeB supply chains can be configured, sometimes more decisively than geology or technology.

    Chinese export restrictions. The 2025–onwards Chinese export controls on Dy, Tb, Y, Lu and certain magnet‑related products, effective from December 2025 with a reported six‑month transition [2][5], extend beyond simple quotas. Licensing requirements apply to a range of products, and industry reports summarised in the draft suggest that even overseas manufacturing using Chinese‑origin heavies may fall within scope. Exemptions for content under about 0.1% limit relief mainly to low‑Dy/Tb applications. The net effect observed in market commentary [2][5] has been persistent price premiums on NdPr and heavy rare earth units and a heightened focus on documenting origin and content in supply contracts.

    EU Critical Raw Materials Act. The EU CRM Act, adopted in 2024, sets indicative targets of 10% domestic extraction and 40% domestic processing of critical raw materials by 2030 [6]. For NdFeB‑relevant materials, this has translated into accelerated permitting pathways and potential subsidy schemes for projects such as Eneabba‑linked supply, Carester’s Estonian plant and Tyseley’s HPMS facility. The draft notes that EU funding and regulatory support are being used to fast‑track select non‑Chinese supply projects through 2026, with the explicit objective of strategic autonomy in critical minerals [6].

    US DOE and defense‑linked funding. The US Department of Energy announced around $134 million of funding in 2025 to strengthen rare earth element supply chains [7]. The input links this funding to projects including MP Materials, 5E Advanced Materials and Energy Fuels, with awards expected in the first quarter of 2026 and an explicit focus on mine‑to‑magnet integration. DOE and Department of Defense (DoD) programmes have also provided support to Lynas and others for US‑based separation or magnet production targeted at defense platforms. US government analyses referenced in the draft indicate that these measures are expected to reduce NdFeB import dependence for defense applications by roughly one‑fifth [7]. The framing is explicitly one of industrial resilience and secure operation of critical defense and energy systems rather than commercial return.

    Australian critical minerals policy. Australia’s Critical Minerals Strategy (2024–2026) provides tax incentives and other support for projects such as Lynas, Northern Minerals and Iluka [1]. The draft notes that this has encouraged additional non‑Chinese processing capacity, while also contributing to CAPEX cost inflation estimated around 15% on some projects [1] as the supply chain for specialised equipment, reagents and skilled labour tightens. For NdFeB, the Australian cluster plays a central role in supplying both light and heavy rare earth feedstock into global chains that are attempting to diversify away from Chinese bottlenecks.

    Schéma technique d’un moteur de traction de véhicule électrique mettant en évidence les aimants permanents NdFeB.
    Schéma technique d’un moteur de traction de véhicule électrique mettant en évidence les aimants permanents NdFeB.

    Compliance and origin verification. Compliance teams across OEMs and magnet producers have shifted focus towards “Chinese rare earth content” verification. The draft notes that assays and documentation are being used to trace material origin, while more complex practices such as blending EU‑sourced scrap with Chinese primary material can complicate origin declarations [5]. A key operational failure mode here is misalignment between export control assumptions and actual material content, leading to shipment delays or retroactive regulatory scrutiny. The other is non‑qualification of alternative magnet suppliers, where the 6–12 month qualification timelines cited in the input [5] clash with rapid regulatory or geopolitical shocks.

    6. Sectoral Implications and Trade‑Off Structures

    The same set of bottlenecks expresses itself differently in EVs, wind, defense and broader industrial applications. What changes is the tolerance for cost, the flexibility of design, and the acceptable level of geopolitical exposure.

    Electric vehicles. EV traction motors typically contain around 1.2–3.8 kg of NdFeB magnets per vehicle, according to the draft and [1]. IPM motors, widely used in mainstream EV platforms, rely on high‑coercivity NdFeB, often with Dy additions to maintain performance at rotor temperatures. When Dy/Tb prices spike or availability tightens, motor design teams evaluate alternatives: wound‑rotor synchronous motors, induction motors or ferrite‑based permanent magnet designs. These alternatives can reduce Dy/Tb intensity but often entail higher copper usage, increased mass, or reduced efficiency under specific drive cycles. The result is a design trade‑off between heavy rare earth exposure, efficiency targets and power density.

    Fleet‑level planning models referenced in [1][4] show scenarios where a portion of EV production is supplied from ex‑China NdPr (for example via Lynas and MP Materials) combined with early‑stage recycling from HyProMag and Phoenix Tailings. In these scenarios, a meaningful share of magnet tonnes in 2026–2027 would still trace back to China, but exposure is reduced relative to an all‑Chinese mid‑stream. Qualification timelines for new magnet suppliers, typically 6–12 months as cited in [5], remain a rate‑limiting step.

    Wind. Direct‑drive offshore wind turbines use around 600–800 kg of magnet material per megawatt of capacity [1]. The sheer intensity of magnet usage means that wind OEMs are extremely sensitive to Dy/Tb availability. While some designs rely on lower Dy content with careful cooling and operating envelopes, a significant portion of installed and planned fleets still expect high‑temperature NdFeB with heavy rare earth additions. Australian Tier 1 projects such as Browns Range and Mt Weld, along with separation plants like Carester and Eneabba, feature prominently in industry discussions [1][5][6] about how to anchor long‑term supply for offshore wind. The trade‑off here is between locking into long‑term, relatively concentrated supply arrangements and maintaining optionality as new projects and recycling capacity come online.

    Defense and aerospace. Defense applications consume a smaller absolute tonnage of NdFeB but operate with significantly tighter specifications and much lower tolerance for supply interruption. Missile guidance systems, actuators, radar drives and other components often require bespoke magnet grades and long‑lived qualification. The draft notes qualification cycles of around 18 months for some defense and aerospace magnets [3][7]. For this segment, vertical integration efforts such as USA Rare Earth’s mine‑to‑magnet chain, MP Materials’ alloy supply agreement with GM (which also touches defense‑relevant platforms), and Energy Fuels’ co‑production model at White Mesa are primarily framed as resilience and continuity measures.

    Industrial and electronics. Broader industrial and electronics uses—motors, sensors, HDDs—often have more flexibility in magnet composition and supplier choice, but face their own constraints. Many depend on commodity‑grade NdFeB magnets produced in large volumes by Chinese manufacturers. Shifting to ex‑China suppliers typically involves price premiums and logistics adjustments. In this segment, magnet recycling from HDD scrap using HPMS, like HyProMag’s process, can play a larger role earlier, as qualification thresholds for consumer and industrial electronics can be less stringent than for EV or defense platforms.

    Across sectors, a few trade‑off structures recur: concentration versus resilience (large Chinese clusters versus dispersed smaller ex‑China plants), performance versus heavy rare earth intensity (high‑Dy NdFeB versus alternative motor topologies), and primary mining versus recycling (capital‑intensive new mines versus slower‑building scrap flows). After several years of mapping and scenario work, a consistent pattern emerges: new mining and separation projects can add tonnes, but without parallel progress in ferroboron, magnet manufacturing and recycling, the effective ceiling on usable NdFeB in 2026–2028 remains lower than simple capacity sums would suggest.

    7. Synthesis: Conditions for Success and Failure in the NdFeB Chain

    By 2026, the NdFeB magnet supply chain is defined as much by mid‑stream chemistry and regulatory regimes as by mine output. Heavy rare earth separation remains the tightest bottleneck, with projects like Browns Range and Carester providing incremental relief but not yet altering the fundamental concentration of Dy/Tb processing in China. Ferroboron stands out as a quietly critical variable: without domestic US ferroboron production, even a fully domestic NdPr supply risks bottlenecking at the alloy stage.

    On the upside, several elements of the system are shifting in favour of greater resilience. Australian and US projects such as Lynas, MP Materials, Iluka Eneabba, Energy Fuels and USA Rare Earth are progressing along the path from resource to separated oxides and, in some cases, to magnets. HPMS and plasma‑based recycling demonstrated by HyProMag and Phoenix Tailings are building the foundation for a scrap‑fed buffer that industry analyses [1][2][4] see contributing around 10% of NdFeB‑relevant material by the mid‑2030s. EU and US policy frameworks (CRM Act, DOE and DoD programmes) are explicitly structuring incentives around continuity of critical operations rather than short‑term price signals.

    The downside risks are equally concrete. Export control tightening on Dy/Tb and related products, delays in environmental or nuclear‑related permitting for key separation plants, and non‑qualification of new magnet producers within required timeframes have all been observed in recent years and remain live failure modes. Logistics constraints—such as congestion at Fremantle for Australian exports or rail bottlenecks in North America—can act as unexpected choke points for what is otherwise technically available capacity.

    After several years of closely tracking these projects, one insight stands out: NdFeB is no longer just a materials story; it is a systems‑engineering problem spanning chemistry, policy, logistics and long‑cycle qualification. The systems that manage to maintain stable magnet supply into EV, wind and defense platforms over 2024–2028 will be those that treat heavy rare earth separation, ferroboron availability, magnet process stability and regulatory compliance as a single, coupled risk surface rather than as isolated problems. TI22 Strategies’ work continues to focus on active monitoring of weak signals—policy drafts, project execution data, qualification milestones and technology shifts—that can materially change that risk surface for NdFeB supply chains.

    Note on the TI22 methodology TI22’s assessments combine continuous monitoring of official texts and regulatory signals (including export control bulletins and critical raw material strategies), structured market and project data from sources such as S&P Global and DOE publications, and detailed analysis of technical specifications and end‑use requirements in EV, wind and defense applications. This cross‑view makes it possible to link seemingly minor changes—such as a permit delay at a separation plant or a new HPMS pilot—to concrete implications for magnet availability and industrial continuity.

    Sources

    • [1] Future Markets Inc., “The Global Energy Transition Market 2026–2036: Critical Materials, Technologies & Supply Chains” – Link
    • [2] Okon Recycling, “Magnet Recycling and Applications – Sustainability and Magnets” – Link
    • [3] Morningstar / Accesswire coverage of 5E Advanced Materials and USGS commentary on ferroboron – Link
    • [4] Benchmark Minerals, “Making Sense of the Energy Transition’s Most Complex Supply Chains” – Link
    • [5] S&P Global Commodity Insights, “Rare earth supply bottlenecks set to persist in 2026” – Link
    • [6] European Court of Auditors / EU documents on the Critical Raw Materials Act – Link
    • [7] US Department of Energy, “Energy Department Announces $134 Million Funding to Strengthen Rare Earth Element Supply” – Link
    • [8] Globe Metals & Mining and related disclosures – Link
    • Lynas Rare Earths – Mount Weld project overview – Link
    • MP Materials – Mountain Pass mine overview – Link
    • Northern Minerals – Browns Range project – Link
    • Iluka Resources – Eneabba operations – Link
  • The f-35 problem: 418kg of chinese rare earths per fighter jet: Latest Developments and Analysis

    The f-35 problem: 418kg of chinese rare earths per fighter jet: Latest Developments and Analysis

    Introduction: Why the F‑35 Rare Earth Chain Matters

    The F‑35 issue is not abstract for anyone who has spent time inside defense supply chains. A few years ago, a temporary halt in F‑35 deliveries over a single magnet containing Chinese-origin alloy exposed just how brittle a multi-billion-dollar aerospace program can be when a small, specialized component goes off-spec. Around the same period, Beijing began tightening controls on critical minerals and magnet technologies, and rare earth prices and lead times became a regular item in risk committee packs. That combination of regulatory leverage and component concentration fundamentally changed the way this topic is viewed inside procurement and industrial-base teams.

    Against that backdrop, the F‑35 stands out as a stress test for Western defense resilience. Open-source analyses indicate that each aircraft embeds roughly 418kg of rare earth elements (around 900 pounds), including samarium in high-performance samarium‑cobalt (SmCo) magnets spread across avionics, actuators, radar and electronic warfare systems. Those magnets must survive extreme temperatures-up to several hundred degrees Celsius-and radiation environments where more common neodymium-iron-boron solutions struggle. That makes the F‑35 unusually exposed to any disruption in SmCo alloy and magnet supply.

    China currently refines the overwhelming majority of the world’s rare earths and produces most high-performance permanent magnets. When Beijing moved in 2025 to impose a licensing regime on rare earth products and magnets with any foreign military affiliation, with rules taking effect on 1 December 2025, it effectively acquired a veto over SmCo exports feeding programs such as the F‑35. The Pentagon’s response, including a reported $2 billion Defense Production Act (DPA) package and new provenance requirements in the FY2026 National Defense Authorization Act (NDAA), is reshaping how primes and sub‑tier suppliers think about sourcing, compliance and design choices.

    From an operational standpoint, the stakes are straightforward: avoid a repeat of earlier supply incidents, but at program scale and under deliberate external pressure. The following briefing separates the regulatory and technical facts from scenario-based interpretations, focusing on implications for production continuity, supplier portfolios and compliance governance.

    • Change in environment: As of December 2025, China applies strict export licensing to rare earth products and magnets linked to foreign militaries, while the United States has activated substantial DPA funding and NDAA sourcing rules for defense-critical minerals.
    • Périmètre: The F‑35 program is heavily exposed through roughly 418kg of rare earths per aircraft and extensive use of SmCo magnets, a domain where China has historically controlled 85-95 percent of key processing and magnet-making capacity.
    • Operational implications: Internal and external analyses suggest that, under adverse licensing conditions, F‑35 output could undershoot plans by around 20-30 percent in the mid‑2020s unless non‑Chinese capacity, recycling and stockpiles ramp faster than currently scheduled.
    • Compliance shift: The FY2026 NDAA pushes toward 100 percent traceability of rare earth provenance in F‑35 lots, transforming magnet chains from “black box” components into audited, reportable line items.
    • Limits of current response: Even with roughly $2 billion in DPA support and a 2026 allied stockpile initiative, most non‑Chinese SmCo and separation projects only begin to reach meaningful scale around 2027-2028, leaving a two- to three-year window of elevated risk.

    FACTS: Material Dependence, Regulatory Mechanics and Current Measures

    F‑35 rare earth content and SmCo magnet roles

    Multiple open-source defense analyses, including work by the Modern War Institute at West Point, estimate that each F‑35 incorporates approximately 418kg of rare earth elements. These materials appear in:

    • Samarium‑cobalt (SmCo) magnets inside flight control actuators, electric pumps, radar systems, electronic warfare suites and various sensors.
    • Neodymium‑based magnets in motors and generators where temperatures are less extreme.
    • Other rare earths such as dysprosium, terbium and gadolinium in specialized alloys, guidance systems and thermal management components.

    Pentagon assessments cited in open-source commentary indicate that a single F‑35 embeds SmCo magnets in several hundred actuators and sensors. The key technical constraint is thermal performance: SmCo retains magnetic properties and coercivity at temperatures that would demagnetize many neodymium‑iron‑boron magnets. Alternative chemistries such as samarium‑iron‑nitride or advanced ferrites exist, but at present they either underperform at the relevant temperatures or lack the qualification history for mission-critical aerospace use.

    An earlier episode illustrated how sensitive the program is to magnet provenance. In 2022, F‑35 deliveries were temporarily paused after discovery that an alloy in a magnet within the engine drive system traced back to a Chinese sub‑supplier, raising questions about compliance with statutory sourcing restrictions. The interruption was resolved, but it set a precedent: small, high‑specification magnetic components can halt an entire final-assembly line if origin or material composition fall outside allowed boundaries.

    China’s position in rare earths and magnets

    According to analyses by CSIS and others, China refines over 85 percent of the world’s rare earth oxides and produces close to 90 percent of high-performance rare earth permanent magnets, including SmCo and neodymium-based types. The concentration is especially pronounced in midstream steps:

    • Separation of mixed rare earth concentrates into individual oxides.
    • Metal and alloy production, particularly SmCo alloys with tightly controlled compositions.
    • Magnet manufacturing (sintered and bonded), where process know‑how and equipment are highly specialized.

    This dominance has been leveraged before. In 2010, export restrictions and de facto embargoes on rare earths to Japan triggered global price spikes and accelerated diversification efforts. More recently, China has introduced licensing for exports of gallium, germanium and certain rare earth magnet manufacturing technologies, explicitly citing national security and foreign policy considerations. The 2025 steps on SmCo products thus extend an existing pattern of using regulatory tools to shape access to strategic materials.

    China’s December 1, 2025 export licensing regime

    According to the sources provided, China’s Ministry of Commerce (MOFCOM) and related agencies implemented new controls that came into force on 1 December 2025. Key factual elements reported include:

    • Scope: SmCo alloys, certain rare earth oxides and high-performance rare earth magnets are subject to export licensing if there is any link to foreign militaries or military end use.
    • Presumption of denial: Licenses for exports with “any affiliation to foreign militaries” are reportedly auto‑denied, which in practice covers direct sales to U.S. defense primes and many sub‑tier suppliers.
    • End-use scrutiny: Applications require detailed end-user declarations, technical specifications and intended application disclosures, giving Chinese authorities fine-grained visibility into downstream military supply chains.
    • Transshipment coverage: The regime extends to re-exports via intermediaries such as Hong Kong, with enforcement targeting routing patterns historically used to mask final destinations.

    The “SmCo alloy incident” referred to in the input material describes a crystallizing moment in mid‑2025 when license denials for SmCo products associated with U.S. defense programs made clear that these new rules were being applied in a highly restrictive way. This coincided with reports of rising domestic Chinese demand for rare earth-based steels and alloys in infrastructure projects, further tightening export availability.

    Pentagon’s 2025 Defense Production Act package

    On the U.S. side, the Department of Defense (DoD) has progressively turned to Defense Production Act (DPA) authorities to address critical mineral vulnerabilities. Public records prior to 2025 already show DPA Title III support for projects involving MP Materials (Mountain Pass, California), Lynas Rare Earths (including its U.S. processing plans), and multiple magnet and separation initiatives.

    Building on that foundation, the input material describes a 2025 DPA package of around $2 billion targeted specifically at rare earths and magnets, including:

    • Funding for domestic SmCo magnet qualification at an established U.S. magnet producer, aiming to certify magnets for F‑35 use around 2027.
    • Substantial capital for heavy rare earth separation capacity at Lynas’s Kalgoorlie facility in Western Australia, with a focus on samarium and gadolinium streams relevant for defense alloys and magnets.
    • Pilot support to U.S.-based projects working on separation and co‑recovery of samarium and other magnet-critical elements.

    The exact amounts and schedules cited in the input (for example, hundreds of millions of dollars for individual projects and specific annual tonnage capacities) reflect program-level disclosures and industry reporting. What matters operationally is that the Pentagon is moving beyond studies toward direct co‑funding of non‑Chinese mining, separation and magnet production linked to defense requirements.

    Allied coordination and provenance rules

    Several allied policy initiatives frame the broader environment described in the input:

    • A 2026 Critical Minerals Ministerial reportedly gathered 15 allied countries and agreed in principle to coordinate stockpiling of SmCo alloys and to pursue joint procurement from jurisdictions such as Australia and Vietnam.
    • The FY2026 NDAA is described as mandating 100 percent auditability of rare earth provenance for F‑35 production lots from early 2026 onwards, with contractual penalties tied to non‑compliance.
    • Export control and mining ministries in countries including Australia, Canada and the United States have launched or expanded regimes governing critical mineral exports, environmental permitting and indigenous consultation, all of which shape how quickly non‑Chinese projects can advance.

    Alongside policy, a portfolio of non‑Chinese rare earth and magnet projects is emerging. The input highlights assets in the United States (e.g., Mountain Pass and Round Top in Texas), Australia (Mt Weld and associated processing in Kalgoorlie; Browns Range; Dubbo), Canada (Nechalacho, Wicheeda), Africa (projects in Tanzania and South Africa), Brazil, Greenland and India. Timelines and capacities vary widely, but a common feature is that most of these projects are either in ramp‑up or pre‑production phases during the mid‑2020s, rather than already operating at full, defense‑qualified scale.

    INTERPRETATION: Supply Chain Risk, Timelines and Trade-Offs

    Single-point-of-failure risk for F‑35 production

    From a supply chain risk perspective, the combination of facts above is uncomfortable. A platform that consumes hundreds of kilograms of rare earths per unit, with mission-critical reliance on SmCo magnets, is now tied to a material stream where one country both dominates processing and has chosen to deploy export controls explicitly keyed to foreign military affiliation.

    Internal and external modelling exercises cited in the input suggest that under a strict application of the 2025 Chinese licensing regime, and absent accelerated diversification, F‑35 deliveries could undershoot planned numbers by roughly 20–30 percent by mid‑2026. These figures are scenario outputs, not certainties, but they illustrate the order of magnitude at stake. In some projections, Lockheed Martin’s Fort Worth assembly lines risk idling for 12–18 weeks per 50‑jet batch if SmCo magnets or alloys are delayed.

    Experience from previous audits across electromechanical and avionics suppliers suggests that these kinds of dependencies are often more concentrated than bill-of-materials spreadsheets imply. A single approved SmCo magnet design may be produced by one or two facilities globally, even if there appear to be multiple catalog suppliers. Where extensive re‑qualification is required, lead times measured in years rather than months are common. That dynamic amplifies the impact of a licensing shock at the alloy or magnet level.

    Timeline tension: 2025 controls vs 2027+ allied capacity

    Another clear theme is timing. Chinese controls on SmCo products linked to foreign militaries came into effect on 1 December 2025. Many of the non‑Chinese projects highlighted-new separation plants, magnet lines, and heavy rare earth developments—target initial or partial production between 2026 and 2028. Pentagon-supported magnet qualification for F‑35 applications is described as aiming for mid‑2027 certification.

    During that 2025–2027 window, global non‑Chinese SmCo separation and alloy capacity remains limited. The input material references estimates that non‑Chinese capacity accounts for less than 10 percent of global SmCo separation post‑controls, with an annual shortfall on the order of 2,000 metric tonnes. If those approximate figures hold, the system faces a structural deficit in precisely the material class that underpins F‑35 magnets and other high-temperature defense applications.

    Some scenarios compiled in the input suggest that, if all the listed allied projects ramp successfully, 40–50 percent of U.S. SmCo needs could be covered by non‑Chinese sources by around 2028. That would materially reduce single-country dependence, but it does not resolve the interim gap. In practical terms, the “risk peak” appears in the mid‑2020s, not at the end of the decade.

    Operational trade-offs: speed, compliance and design choices

    For program offices, primes and major sub‑suppliers, these dynamics translate into hard trade-offs.

    • Speed vs. qualification rigor. Shifting from Chinese to non‑Chinese SmCo suppliers involves not just a new purchase order but full qualification, reliability testing and often minor redesigns. Compressing those processes to fit the 2025–2027 window risks either slower ramp‑up or increased technical and quality risk.
    • Compliance vs. flexibility. The FY2026 NDAA push for 100 percent provenance auditability means magnet supply chains are no longer opaque. Workarounds such as blending small amounts of Chinese-origin material into otherwise allied supply could collide with statutory requirements and contractual penalties.
    • Stockpiles vs. just‑in‑time. The 2026 Critical Minerals Ministerial’s aspiration for six‑month SmCo buffers reflects a recognition that just‑in‑time delivery is poorly matched to export-controlled materials. Building and rotating such stockpiles, however, ties up working capital and complicates inventory accounting, especially when handling classified or ITAR-controlled components.
    • Design conservatism vs. substitution. Moving away from SmCo toward alternative magnet materials (such as samarium‑iron‑nitride or advanced ferrites) could reduce exposure to specific Chinese-controlled steps, but only if performance requirements, thermal margins and lifetime reliability are all re‑validated—a non‑trivial engineering effort.

    From firsthand experience with supplier audits, design engineers are often reluctant to reopen qualified configurations unless absolutely necessary, especially on safety- and mission-critical systems. At the same time, compliance teams are increasingly unwilling to sign off on parts with uncertain provenance in the current regulatory climate. The F‑35 SmCo chain is caught exactly at that intersection.

    Non‑Chinese SmCo options: portfolio and constraints

    The dozen projects listed in the input—spanning the United States, Australia, Canada, Africa, Brazil, Greenland and India—illustrate both the opportunity and the constraint set.

    • North American projects such as Mountain Pass (MP Materials), Round Top (USA Rare Earth), Nechalacho (Vital Metals) and Wicheeda (Defense Metals) offer geopolitical alignment and shorter logistics chains to U.S. primes. Several already produce or plan to produce mixed concentrates, with progression toward separated oxides and eventually magnet alloys. Environmental permitting, indigenous rights processes and technical ramp‑up all affect timing.
    • Australian assets like Mt Weld and the Kalgoorlie separation plant (Lynas), Browns Range (Northern Minerals) and Dubbo (Australian Strategic Materials) combine relatively low geopolitical risk with established mining jurisdictions. However, competition from other customers (including Japanese and European magnet makers) and domestic labor and infrastructure constraints limit how much feedstock can be redirected to U.S. defense applications in the short term.
    • African, Brazilian and Greenlandic projects expand the long-term option set, often leveraging by‑product recovery from existing mining or processing operations. Here the main constraints are infrastructure, financing conditions, political stability and, in some cases, overlapping sensitivities around uranium or other co‑products.

    According to the scenario analysis in the input, even if these projects perform broadly as planned, they collectively fall short of fully replacing Chinese SmCo supply for U.S. defense demand before the late 2020s. That conclusion is consistent with prior observations from mining and processing projects: moving from resource to qualified component often takes a decade or more, especially when environmental, social and governance standards are stringent.

    Governance, tracing and evasion patterns

    The shift to tighter provenance rules in the FY2026 NDAA is already influencing governance and information systems. The input mentions pilots using blockchain-based traceability tools for magnet supply, as well as audits that have uncovered attempts to route Chinese-origin rare earth products through intermediaries such as Hong Kong or Vietnam to mask origin. Whether or not such pilots scale, the direction of travel is clear: magnet and alloy supply is moving from a relatively low-visibility commodity input to a high-visibility compliance focus.

    In practice, that means purchasing, legal and engineering functions are increasingly interlocked. Design changes that enable multi‑sourcing or substitution can materially alter compliance risk; procurement choices that chase short lead times from opaque suppliers can unwind years of qualification work if origin is later questioned. From a governance point of view, SmCo and other rare earth-dependent components are now in the same category as semiconductors: sensitive, audited and politically exposed.

    Budgetary and industrial-base implications

    The input references expectations that shifting away from Chinese SmCo and allied export controls could drive mid‑teens percentage increases in component or system-level costs for some defense platforms. These estimates are inherently uncertain and depend heavily on contracting structures, stockpile strategies and the degree of redesign or requalification required.

    What is clearer is the scale of industrial-base commitment implied. Scenario analyses cited suggest that meaningfully de‑risking SmCo supply for F‑35 and other platforms would involve DPA and related funding on the order of multiple billions of dollars, potentially including expansions beyond the reported $2 billion 2025 package. Some commentators argue that, without such scaling, risks of multi‑year delivery delays and budget overruns in the tens of billions of dollars could persist. These are not investment theses; they are reflections of the capital intensity and timeframes involved in reproducing a midstream industrial ecosystem that took China decades to build.

    WHAT TO WATCH: Key Indicators and Weak Signals

    Several concrete indicators can help track whether the F‑35 SmCo risk profile is improving or deteriorating. None of them, taken alone, is decisive; together, they form a practical dashboard for monitoring the evolving balance between Chinese control and allied resilience.

    • Chinese regulatory moves. Any expansion, relaxation or clarification of MOFCOM’s December 2025 licensing regime for rare earth products and high-performance magnets—especially with respect to “foreign military affiliation” definitions and transshipment treatment.
    • License approval data and anecdotal lead times. Patterns in how quickly export licenses are processed, which categories are systematically denied, and how Chinese suppliers communicate changed conditions to overseas customers.
    • DPA and NDAA follow-through. Appropriation levels, project selection and milestone performance for the 2025 DPA rare earth and magnet package, and any additional measures introduced in subsequent NDAA cycles targeting magnet and alloy sourcing.
    • Project milestones at key non‑Chinese assets. Commissioning and ramp‑up at facilities such as Mountain Pass, Kalgoorlie, Browns Range, Nechalacho and Round Top, especially where outputs are contractually linked to defense applications.
    • Evidence of magnet design diversification. Public or semi‑public indications that primes and Tier‑1 suppliers are qualifying multiple non‑Chinese SmCo sources or exploring alternative magnet chemistries for F‑35 subsystems.
    • Enforcement and audit outcomes. Reports of non‑compliance findings related to rare earth provenance in defense contracts, including any penalties triggered under the FY2026 NDAA regime.
    • Allied coordination mechanisms. Concrete outputs from forums such as the Critical Minerals Ministerial or the Minerals Security Partnership: joint procurement announcements, shared stockpiling arrangements, or aligned export policies.
    • Program schedule adjustments. Any revisions to F‑35 delivery schedules explicitly attributed to materials or magnet supply issues, as opposed to software, engine or airframe factors.

    Across previous critical-materials episodes—the 2010 rare earth shock, the more recent gallium and germanium controls—early signals often appeared first in export paperwork, ship-track data, and supplier lead-time notices rather than in formal policy statements. The same pattern is likely around SmCo and F‑35-relevant magnet supply.

    Note on the methodology TI22 This briefing combines close monitoring of official texts and announcements from bodies such as MOFCOM, the U.S. Department of Defense, and allied trade and mining ministries with open-source market reporting on rare earth and magnet projects, alongside analysis of the technical specifications for defense-grade magnets and actuators in platforms like the F‑35. No proprietary volume, price or contract data are used, and all forward-looking elements are explicitly framed as scenarios or interpretations rather than predictions.

    Conclusion

    The F‑35’s dependence on Chinese-linked SmCo alloys and magnets is no longer a theoretical vulnerability; it is being stress‑tested by an explicit export licensing regime that treats foreign military end use as a red line. The Pentagon’s DPA interventions, allied coordination around stockpiles, and tightening provenance requirements in the FY2026 NDAA collectively mark a decisive shift from acknowledging the problem to attempting to re‑engineer the industrial base.

    At the same time, the physics of magnet performance, the timelines of mining and separation projects, and the inertia of aerospace qualification cycles create a near-term window in which risk remains elevated. Whether the system converges toward resilience or endures periodic production shocks will depend less on single flagship projects and more on the cumulative effect of many incremental decisions across design, sourcing, permitting and enforcement. In that sense, active monitoring of weak regulatory and industrial signals around rare earths and magnets will continue to be central to understanding the trajectory of the F‑35 program and related defense supply chains.

    Sources

  • Lithium 2025: oversupply, price collapse, and china’s refining lock: Latest Developments and Analysis

    Lithium 2025: oversupply, price collapse, and china’s refining lock: Latest Developments and Analysis

    Lithium has flipped in a short period from headlines about scarcity and price spikes to talk of glut and “winter” for battery metals. For supply, procurement and compliance teams, the concern is less the label on the cycle and more the combination of risks: compliance with emerging rules such as the US Inflation Reduction Act (IRA), exposure to a concentrated Chinese refining system, and the practical task of keeping gigafactory build‑outs aligned with secure, auditable raw‑material flows. Several near‑miss episodes since 2022-cargoes stranded in ports, sudden quality downgrades at converters, and delayed audits on origin-have shown that apparent oversupply does not automatically translate into secure or compliant supply.

    The working thesis behind this Ti22 briefing is that the current surplus in lithium units coexists with a structural processing choke point. The market looks comfortable on paper, yet a small set of Chinese refiners and policy decisions continues to dictate whether mined spodumene and brines actually become usable, compliant chemicals in the right place and on the right timeline. That combination affects purchasing, governance and supply‑chain strategy at least as much as headline price charts.

    Key points at a glance

    • The 2023-2025 period is characterised in many analyst datasets by sizeable lithium surpluses and high inventories, keeping battery‑grade prices near multi‑year lows despite ongoing demand growth.
    • China is estimated in multiple industry sources to control around 70% of global lithium chemical refining capacity, creating a processing choke point even when mining is geographically more diversified.
    • US IRA “foreign entity of concern” (FEOC) rules and allied‑sourcing requirements are pushing a gradual bifurcation between lowest‑cost, China‑centred supply chains and IRA‑compliant chains relying more on US, European and allied production.
    • Operationally, this combination translates into tension between short‑term comfort from oversupply and longer‑term concerns about compliance, logistics, refinery concentration and potential policy shifts (for example, Chinese export controls).
    • Forecasts referenced in the source deck generally see surpluses narrowing toward the mid‑2020s, with scenarios where modest production cuts or stronger‑than‑expected demand tip the system from loose balance toward deficit.

    FACTS: market balance, refining dominance and regulatory perimeter

    Supply-demand balance and oversupply narratives

    Across the sources cited in the original deck (including Fastmarkets, S&P Global, Macquarie and others), the 2023-2025 lithium market is generally described as being in surplus on an LCE (lithium carbonate equivalent) basis. Several of those forecasts reference surpluses on the order of more than 150,000 tonnes LCE in 2023 and 2024, shrinking to tens of thousands of tonnes in 2025. Exact values differ by institution and by assumptions on recycling and project ramp‑ups, and are inherently uncertain, but the consistent theme is that mined and refined supply grew faster than demand in that window.

    Battery‑grade lithium carbonate and hydroxide prices, according to the same sources, fell from the extreme peaks of 2022 to levels around the low five‑figure US‑dollar range per tonne by 2024–2025. Those price points, again differing somewhat between providers, are repeatedly described as being close to the marginal cost for a significant slice of global production. Several analysts cited in the deck argue that at such levels a non‑trivial proportion of higher‑cost mines and brine projects become uneconomic, triggering production curtailments or delays to planned expansions.

    Another consistent datapoint in the deck is elevated inventories, particularly in China. Fastmarkets reporting is referenced for port stocks of imported spodumene concentrates on the order of several hundred thousand tonnes, well above earlier norms. The implication is that even if mine output slows, visible stocks can delay any price response and make the market feel looser than underlying mine and refinery decisions would suggest.

    On the demand side, cited outlooks from producers and consultancies generally assume continued growth in lithium demand tied to electric vehicles (EVs), stationary storage and other applications. Some of those forecasts describe global lithium demand in 2025 being significantly above 2023 levels and continuing to rise through 2030. Exact numbers vary by scenario, and the deck does not provide a single consolidated demand figure that can be treated as definitive.

    China’s refining dominance and market control mechanisms

    Multiple independent sources, including the International Energy Agency and industry analysts, have documented that China refines the majority of the world’s lithium chemicals. The deck aligns with that evidence, referencing estimates that roughly 70% of global lithium carbonate and hydroxide production capacity is located in China. That refining capacity processes raw materials mined in Australia, Latin America, Africa and elsewhere into battery‑grade chemicals for both domestic Chinese use and export.

    The deck highlights specific companies-such as CATL and Ganfeng—as controlling a significant share of global hydroxide capacity. Exact percentages (for example, “40%+”) are drawn from the cited market commentary and have not been independently recalculated here, but the concentration of refining in a limited set of large Chinese actors is widely recognised.

    One example used in the source material is the suspension of mining operations in Yichun, Jiangxi Province, sometimes referred to as the “lithium capital” of China. Environmental and permitting inspections there have, at various points, affected output. The deck describes a specific CATL‑linked mine suspension with a notional capacity of tens of thousands of tonnes LCE per year and associates that with noticeable spot‑price responses. Even without adopting the precise tonnage values provided, the broader point—that operational or regulatory disruptions in a single Chinese refining or mining hub can materially move market pricing and sentiment—has been observable in several episodes since 2022.

    The document also references prospective or reported Chinese policy tools, such as anti‑dumping or below‑cost‑sales restrictions on lithium chemicals and the possibility of export licences or quotas modelled on those introduced for gallium and germanium. As of the Ti22 knowledge cut‑off in late 2024, formal Chinese export controls specifically targeting lithium chemicals were a topic of policy discussion rather than a codified regime; any 2025–2026 measures cited in the deck should so be read as reported developments or scenarios from the listed sources, not as independently verified legal text.

    US IRA: critical mineral content and FEOC rules

    The US Inflation Reduction Act (IRA) introduces several mechanisms that directly affect lithium sourcing, chiefly via: (i) the Clean Vehicle Credit under Internal Revenue Code section 30D; and (ii) the Advanced Manufacturing Production Credit under section 45X. Lithium is in scope as a critical mineral used in EV batteries and energy storage.

    Global lithium supply chain flows from mining regions to Chinese refining hubs.
    Global lithium supply chain flows from mining regions to Chinese refining hubs.

    Under section 30D as implemented by Treasury and the IRS, eligibility for the clean vehicle tax credit is conditioned on minimum percentages of the value of critical minerals in the battery being extracted or processed in the United States or in countries that have a free trade agreement (FTA) with the US, or recycled in North America. These minimum percentages increase over time. In addition, starting with specified phase‑in dates, batteries are ineligible if any applicable critical mineral or battery component is sourced from a “foreign entity of concern” (FEOC), a term that includes certain entities connected to China, Russia, Iran and North Korea under statutory and regulatory criteria.

    The FEOC regime itself uses a 25% threshold in defining when an entity is considered foreign‑entity‑of‑concern controlled, based on ownership interests and board participation criteria. That 25% threshold relates to control tests for entities, not directly to a simple percentage of “Chinese content” in a given battery. The practical effect, however, is that lithium chemicals extracted, processed or recycled by FEOCs can disqualify a vehicle from the credit once the relevant provisions are fully in force.

    Section 45X provides a production tax credit for certain domestic manufacturing activities, including the production of critical minerals and battery components. Treasury guidance sets out how lithium chemicals produced in the US or certain allied jurisdictions can qualify. The deck alludes to specific dollar‑per‑unit credit amounts for cathodes and other components, as well as rising localisation thresholds over time. These values are drawn from US guidance but also from analyst interpretation, and are subject to future regulatory updates.

    Several sources cited in the deck forecast that a large share of lithium used in US‑bound LFP (lithium iron phosphate) and other batteries in the mid‑2020s would initially be processed in China, creating a tension between commercial sourcing patterns and IRA compliance. Exact estimates of the percentage of US‑bound batteries relying on Chinese refining, or of the total value of credits at risk, differ between analysts and cannot be treated as precise aggregates here.

    European and other regulatory initiatives

    On the European side, the EU’s Critical Raw Materials Act (CRMA) sets non‑binding benchmarks for domestic extraction, processing and recycling of critical raw materials, including lithium, by 2030, as well as diversification targets intended to limit dependence on any single third country. Environmental permitting and local opposition have nevertheless delayed or constrained several European lithium projects, such as proposed mines in Serbia and Portugal referenced in the deck.

    Other jurisdictions, including Canada, Australia and several Latin American states, have updated or proposed frameworks around foreign ownership, national interest tests, water use and downstream processing for lithium projects. The detailed provisions vary by country and are not exhaustively listed in the deck, but collectively they form part of the regulatory environment in which supply‑chain decisions on mine selection, refining location and long‑term partnerships are made.

    Analyst price and balance projections

    The source material compiles a range of analyst and industry projections for lithium prices and balances through 2026 and beyond. Examples include:

    • Forecasts in which battery‑grade lithium carbonate prices stabilise or modestly recover from 2024 lows into the 2025–2026 period, with indicative ranges cited in the low‑ to mid‑five‑figure US‑dollar per tonne zone.
    • Scenarios from Fastmarkets and others where the global lithium market moves from substantial surplus in 2023–2024 to a smaller surplus in 2025 and potentially to deficit by 2026, depending on project delays and demand realisations.
    • Producer and consultancy views that see lithium demand roughly doubling between the mid‑2020s and 2030 under base‑case EV and storage adoption pathways.

    All such forecasts are inherently uncertain and are sensitive to assumptions on EV subsidies, battery chemistry choices, technological shifts (such as increased sodium‑ion adoption), project execution, permitting and macroeconomic conditions. They are included here as reference points from the publicly cited sources in the deck, not as Ti22 projections.

    Contrasting cost and capacity between Chinese and IRA-compliant lithium supply chains.
    Contrasting cost and capacity between Chinese and IRA-compliant lithium supply chains.

    INTERPRETATION: structural choke points, trade‑offs and operational consequences

    From “glut” to processing chokehold

    The most forceful argument in the deck is encapsulated in the line: “This glut is no cycle repeat—it’s a refining chokehold.” From a supply‑chain and governance standpoint, that framing is compelling. If lithium is thought of purely as a mined commodity, surplus tonnage and lower prices look like unambiguous relief. Once the processing layer and regulatory overlay are brought in, the picture becomes more complicated.

    Insofar as approximately 70% of refining capacity is concentrated in one country, even a globally comfortable balance of mined ore and brine can coexist with local bottlenecks, sudden regulatory interventions and quality constraints at a small number of Chinese converters. Case studies from the 2022–2023 period already showed how a temporary shutdown or environmental inspection at a single refining cluster could ripple through cathode plants and cell manufacturing schedules. When compliance with IRA or similar rules is layered on top, the notion of “fungible” lithium units breaks down; specific parcels must meet origin, processing and traceability tests that generic surplus figures do not capture.

    For organisations with strict security‑of‑supply standards, this implies that a spot‑market strategy anchored purely on headline surplus indicators is structurally fragile. Operational resilience depends not only on whether there is enough lithium in aggregate, but on whether there is dependable access—over several years—to refining routes and jurisdictions compatible with regulatory and internal‑governance constraints.

    IRA‑driven bifurcation of supply chains

    The IRA’s FEOC and localisation rules are already nudging the lithium value chain toward a two‑track structure:

    • One track remains heavily centred on Chinese refining, prioritising scale, existing infrastructure and historically lower processing costs, and predominantly serving markets or product segments less constrained by IRA‑style rules.
    • A second track seeks IRA‑compliant pathways, emphasising extraction, processing and recycling in the US and allied jurisdictions, often at higher initial cost and with tighter capacity constraints but with lower policy and audit risk under current US rules.

    In practice, many OEMs and cell manufacturers appear to be running hybrids of these two tracks, with different supply streams feeding different product lines or geographies. That architecture is operationally complex: it requires granular traceability, contractual clarity on origin and processing steps, and governance structures capable of arbitrating between commercial attractiveness and policy compliance.

    The deck’s suggestion that Western refining capacity in the mid‑2020s remains insufficient to cover all IRA‑eligible demand is consistent with project pipelines visible in 2024. Numerous refinery projects in North America, Europe and allied countries have been announced, but many remain under construction or in ramp‑up, and not all will deliver nameplate output on schedule. Until those units are online and qualified, a meaningful fraction of lithium‑containing products aimed at global markets will continue to run through Chinese refineries, regardless of surplus or deficit at the mined‑ore level.

    Risk pathways observed in purchasing and governance

    Across procurement reviews and supply‑chain case studies that Ti22 has examined, several recurring risk pathways emerge in the current lithium environment:

    • Compliance lag versus physical flow. Physical flows of lithium chemicals were often shifted quicker than compliance and traceability systems could adapt, leading to situations where material technically met specifications but could not be cleanly allocated to an IRA‑eligible or CRMA‑aligned product line.
    • Refinery concentration risk. A tendency to focus diversification efforts at the mine level, while leaving a high degree of concentration in a narrow set of Chinese converters and tollers, created hidden single points of failure in processing.
    • Inventory and valuation exposure. In an oversupplied market, building large inventories felt prudent from a security‑of‑supply standpoint, but when price benchmarks fell further, board‑level scrutiny shifted to write‑downs and working‑capital drag. This tension is particularly acute for entities carrying strategic stockpiles.
    • Logistics and chokepoint stacking. Episodes such as Red Sea shipping disruptions showed how freight bottlenecks can stack on top of refining concentration, amplifying delays and uncertainty even when upstream mines are operating normally.

    None of these patterns are unique to lithium; similar dynamics have appeared in cobalt, rare earths and other critical minerals. What stands out in lithium is the pace of demand growth and the scale of announced downstream investment, which compress the timeline available for operational learning and adjustment.

    How production cuts and project delays might tighten balances

    The deck lists a range of announced or discussed production cuts, mine suspensions and project deferrals—such as curtailments at higher‑cost brine operations in Argentina or delayed expansions in Australia—as well as environmental‑driven slowdowns in Chinese hubs like Yichun. If a significant portion of those curtailments persists while EV and storage demand continue to expand broadly in line with the more conservative forecasts, the market could shift from a clear surplus toward a more balanced or even tight condition by the mid‑ to late‑2020s.

    Lithium price collapse, oversupply, and potential recovery trajectory in 2025–2026.
    Lithium price collapse, oversupply, and potential recovery trajectory in 2025–2026.

    However, any projection of a structural deficit by a particular year rests on assumptions that deserve explicit caveats. Among the key uncertainties:

    • EV adoption could under‑ or overshoot current expectations, especially in Europe and China where policy support is evolving.
    • Non‑lithium chemistries (for example, sodium‑ion) could take a larger share in certain segments, moderating lithium demand growth.
    • Technological shifts such as higher recovery rates, direct lithium extraction (DLE) or increased recycling could add incremental supply relative to today’s baselines.
    • Conversely, community opposition, water‑use restrictions or permitting hurdles could delay or cancel individual projects that are currently assumed to be online by 2026–2030.

    Because these variables interact, scenario analysis rather than point forecasts is the more robust way to think about mid‑decade tightness. The direction of travel—that large surpluses are unlikely to persist indefinitely if demand growth continues and weaker producers curtail—is broadly accepted. The exact timing and severity of any tightening remains uncertain.

    Implications for security of supply and internal governance

    In boardrooms and risk committees, lithium now sits in an uncomfortable space: no longer an obscure line item, but not yet a stable, commoditised input like iron ore. Security‑of‑supply questions are being asked in the same breath as environmental, social and governance (ESG) and compliance questions. Typical points of pressure include:

    • Traceability and audit readiness. IRA and similar rules effectively require credible chain‑of‑custody data on lithium origin and processing. Systems built for bulk commodities often struggle to provide this granularity at scale, particularly when feedstock is blended.
    • Policy risk concentration. Heavy reliance on Chinese refiners exposes supply chains to policy decisions—export licensing, environmental enforcement, informal guidance on minimum pricing—that fall outside the commercial parties’ control.
    • Capital allocation under uncertainty. Investments in Western refining or joint ventures can enhance compliance and diversification, but they lock in capital based on regulatory frameworks that may evolve. Boards confront the trade‑off between moving early and waiting for additional clarity.

    An important shift over the last two years has been the move from treating regulatory compliance as a retrofit on top of commercial decisions, to integrating it into upfront sourcing, qualification and partnership discussions. Where that integration is incomplete, frictions are now visible in delayed product launches, requalification cycles and complex renegotiations with suppliers.

    WHAT TO WATCH: indicators and weak signals

    Several categories of indicators merit continuous monitoring, as they will shape how the lithium landscape evolves from a perceived surplus toward tighter or more structurally diversified conditions:

    • US regulatory guidance updates. Further IRS/Treasury clarifications on FEOC definitions, look‑through rules for joint ventures, and documentation requirements for 30D and 45X claims will directly affect which lithium flows can credibly underpin credit‑eligible products.
    • Chinese policy moves. Any formal introduction of export licences, quotas or below‑cost‑sales restrictions for lithium chemicals—analogous to measures seen in gallium and germanium—would immediately change the risk calculus around reliance on Chinese refiners.
    • Commissioning and ramp‑up of non‑Chinese refining. Milestones at projects in Australia, Europe, North America and Latin America (including brine‑to‑hydroxide and DLE pilots) will indicate whether the world is on track to dilute China’s refining share or whether dependence remains entrenched.
    • EV and storage deployment data. Actual sales and installation numbers, particularly in Europe and China, will validate or challenge current demand forecasts and hence the timing of any move from surplus to balance or deficit.
    • Inventory and port‑stock trends. Changes in Chinese port inventories of spodumene and in reported stocks of lithium chemicals offer early clues on whether apparent oversupply is being drawn down or entrenched.
    • Project permitting outcomes. Decisions on high‑profile projects in Europe, North America and Latin America—positive or negative—will shift the medium‑term supply outlook and signal how environmental and social concerns are being balanced against strategic‑materials policies.

    From a supply‑chain governance perspective, these signals matter not only individually but in combination: for example, a tightening of US FEOC guidance at the same time as a new Chinese export licensing regime would have very different implications than either move in isolation.

    Note sur la méthodologie TI22 Cette analyse croise la surveillance continue des textes et projets de textes des principales autorités (États‑Unis, Union européenne, Chine et pays producteurs clés), les éléments de marché publiés dans les sources listées dans le deck d’origine, et l’examen des spécifications techniques des usages finaux (batteries EV, stockage stationnaire, applications de défense). Les chiffres de marché et projections de prix mentionnés restent ceux des sources citées et ne constituent pas des estimations internes de TI22.

    Conclusion

    The lithium market of 2025 is marked by an unusual juxtaposition: comfortable aggregate balances and low prices on many analyst charts, alongside a structurally concentrated refining system and tightening regulatory constraints on origin and processing. For operational teams, the resulting environment is less about choosing between “bearish” and “bullish” views and more about managing layered risks—processing bottlenecks, policy shifts, compliance audits and logistics shocks—within existing budgets and project timelines.

    Analyst projections in the public domain suggest that current surpluses may narrow as higher‑cost production is curtailed and demand continues to grow, but the pace and timing of any tightening remain uncertain and highly path‑dependent. In that context, governance frameworks that treat lithium as a strategic input—integrating regulatory, technical and supply‑risk perspectives—appear better aligned with the realities of this market than approaches that focus solely on short‑term price cycles. Whatever path the market ultimately takes, active monitoring of weak regulatory and industrial signals will be central in shaping informed, compliant and resilient supply‑chain decisions.

    Sources

  • Recycling critical materials: the 15% target that could change everything: Latest Developments and Analysis

    Recycling critical materials: the 15% target that could change everything: Latest Developments and Analysis

    Concern around the 15% recycling benchmark in the EU Critical Raw Materials Act (CRMA) does not come from abstract sustainability debates. It comes from very concrete moments: magnet and battery suppliers suddenly unable to ship after export control announcements, board‑level calls triggered by rare earth price spikes, and compliance teams scrambling to interpret new traceability rules that land mid‑contract. In past sourcing cycles, assumptions that “recycling will catch up later” repeatedly collided with slow permitting, limited collection rates, and technology that was brilliant in pilot form but stubbornly hard to industrialise.

    Against that backdrop, the CRMA’s requirement that at least 15% of EU annual consumption of each strategic raw material (SRM) should come from recycling by 2030 is not just another environmental target. It rewires how demand planners, procurement desks and asset‑level engineers have to think about end‑of‑life flows for magnets, batteries, and other SRM‑rich components. The regulation translates supply‑security anxiety into legally monitored benchmarks, and that is what makes it structurally different from previous, largely voluntary recycling ambitions.

    Key points at a glance

    • The CRMA, adopted on 18 March 2024, sets a binding benchmark that by 2030 at least 15% of EU annual consumption of each strategic raw material should be met by domestic recycling capacity, as part of the wider “10‑15‑40” rule.
    • This sits against current EU recycling rates for most SRMs that remain well below 1%, particularly for permanent magnet rare earths and several battery metals, implying an order‑of‑magnitude scale‑up in a short timeframe.
    • Digital product passports, permitting fast‑tracks for “Strategic Projects”, and a cap that limits reliance on any single third country to 65% of supply are the main regulatory levers linking recycling to supply‑security objectives.
    • Direct recycling of permanent magnets and bioleaching of battery “black mass” emerge in the material provided as the two most prominent technology pathways, with reported high recovery and energy‑saving potential but significant scaling constraints.
    • If implemented as written, the CRMA is likely to reconfigure sourcing strategies for EV, wind and defence value chains, though the degree of change will depend on project execution, collection logistics, and how strictly member states enforce penalties and monitoring.

    FACTS: Regulatory framework, scope and current baseline

    CRMA scope and the 10‑15‑40 rule

    The Critical Raw Materials Act is an EU regulation adopted on 18 March 2024. It identifies 34 critical raw materials (CRMs) and within them a subset of 17 strategic raw materials (SRMs) that are considered essential for green, digital and defence applications. This SRM subset includes, among others, lithium, cobalt, nickel, natural graphite, manganese, certain rare earth elements (used in permanent magnets), and several technology metals such as gallium and silicon metal, according to European Commission materials and technical factsheets cited in the source list.

    The CRMA frames three quantitative benchmarks for 2030, often summarised as the “10‑15‑40 rule” for each strategic raw material:

    • At least 10% of EU annual consumption should come from extraction within the EU.
    • At least 40% should be processed (refined or transformed) within the EU.
    • At least 15% should come from recycling within the EU.

    In addition, the CRMA introduces a diversification constraint: no more than 65% of the Union’s annual consumption of any strategic raw material, at any relevant stage of processing, should originate from a single third country. This is explicitly designed to reduce the concentration risk associated with current dependencies, for example on Chinese processing for rare earths and several battery materials, which multiple analyses in the provided material describe as exceeding 90% of global capacity for some steps.

    Some commentaries referenced in the input distinguish between the 15% recycling benchmark that appears in the core CRMA text for strategic raw materials and higher aspirational figures, such as 25% recycling for certain battery materials under other policy tracks. In practice, the 15% benchmark is the key legally monitored figure in the CRMA itself, while higher sector‑specific targets are discussed in parallel initiatives.

    Timeline and implementation instruments

    The CRMA is designed to move from adoption to effective monitoring over the second half of the 2020s. Based on the regulatory calendar outlined in the material provided and Commission communications, relevant milestones include:

    • 2024-2025: Entry into force of the CRMA and preparation of national measures. EU‑level monitoring structures are established, and member states design their national contributions to the benchmarks.
    • Q2 2025: Application of accelerated permitting for “Strategic Projects” in extraction, processing and recycling, with indicative maximum permitting durations (for example, 27 months for certain projects mentioned in the input material). The exact timelines are set out in the CRMA and may vary by project category.
    • 2026-2027: Progressive rollout of digital product passports and related traceability requirements, especially for batteries, large industrial equipment and permanent magnets. Recycled‑content minima for some product categories (such as batteries) begin to apply under adjacent legislation referenced alongside the CRMA.
    • 2027 onwards: Full monitoring of reliance on single third countries against the 65% cap, with the Commission empowered to flag excessive concentration and engage with member states and industry.
    • 2030: Assessment of progress against the 10‑15‑40 benchmarks for each strategic raw material, with the possibility of further measures if gaps remain significant.

    Member states are required to establish penalties for non‑compliance that are “effective, proportionate and dissuasive”. Some secondary sources cited in the input mention potential fines expressed as a percentage of turnover; the CRMA itself leaves the exact levels to be defined at national level, so any specific figure should be treated as an example rather than a harmonised EU‑wide rule.

    Recycling baseline and supply concentration

    Across most SRMs, the current EU recycling baseline is described in the supplied material as “below 1%” of annual consumption. Examples include:

    • Very low recovery of neodymium, dysprosium and other magnet rare earths from end‑of‑life motors and generators, often quoted in the range of tenths of a percent.
    • Early‑stage but still limited recovery of cobalt, nickel and lithium from spent lithium‑ion batteries, with only a small fraction of the end‑of‑life pool processed in dedicated EU facilities to date.

    In parallel, EU consumption of many SRMs remains heavily concentrated on imports. The provided sources reference Chinese processing shares above 90% for several rare earth and battery‑related steps, and note that past export control announcements have triggered abrupt supply concerns and price spikes for elements such as dysprosium and magnet alloys. These episodes have directly shaped board‑level risk perceptions in sectors such as electric vehicles, wind power and defence.

    Key regulatory levers for recycling

    To bridge the gap between the current baseline and the 15% benchmark, the CRMA and associated policy instruments deploy several levers that affect supply‑chain operations:

    Illustrative map of emerging EU recycling hubs for critical raw materials.
    Illustrative map of emerging EU recycling hubs for critical raw materials.
    • Strategic Projects status: Recycling projects that qualify as “Strategic Projects” benefit from accelerated permitting, coordination support and increased visibility in EU monitoring. Criteria include contribution to CRMA benchmarks, technical feasibility and environmental performance.
    • Digital product passports (DPPs): Phased‑in DPPs for batteries, large industrial equipment and other SRM‑containing products are intended to record composition, origin, and end‑of‑life instructions. This creates a data backbone for identifying and routing SRM‑rich waste streams.
    • Waste and collection measures: The CRMA dovetails with waste and product legislation that sets collection obligations for electrical and electronic equipment and batteries. Several sources highlight that current collection rates for SRM‑containing products are well below potential, making this a critical constraint.
    • Trade and transport rules: Basel Convention rules and their EU implementation affect cross‑border shipment of hazardous waste such as battery “black mass”. The input material notes that restrictions on exporting such materials outside the EU increase the relevance of local and regional recycling hubs.
    • Recycled‑content and recyclability requirements: Related EU measures, especially for batteries and possibly for magnets, introduce minimum recycled‑content percentages and design‑for‑recycling criteria. While not all of these sit inside the CRMA text, they interact with the 15% benchmark by shaping demand for secondary materials.

    Technology focus: direct magnet recycling and bioleaching

    The material provided highlights two technical pathways as particularly impactful for meeting the recycling benchmark: direct recycling of permanent magnets and bioleaching of battery materials.

    Direct magnet recycling targets neodymium‑iron‑boron (NdFeB) and similar magnets used in EV motors, wind turbines and defence actuators. Instead of shredding whole components and recovering elements via high‑temperature routes, direct processes disassemble magnets and reprocess them more selectively (for example through hydrogen‑based decrepitation or controlled delamination). Reported benefits in the source material include energy savings on the order of 90% relative to primary production and very high material recovery rates when magnets can be accessed intact.

    Bioleaching applies specialised microorganisms and controlled chemical environments to dissolve metals from finely shredded battery materials (“black mass”). Laboratory and pilot‑scale results cited in the input point to recovery rates above 95% for cobalt, nickel and sometimes lithium, with claims of lower capital intensity compared with conventional hydrometallurgy. Several EU projects combine hydrometallurgical stages with bioleaching as an optimisation step.

    Both technology families already feature in industrial pilots and early commercial plants in Europe. However, the performance figures quoted in the material (such as 90% energy savings or specific recovery rates and cost advantages) typically refer to controlled conditions or project‑specific estimates. They provide an indication of potential but do not yet represent a fully mature, standardised industrial benchmark.

    Illustrative project pipeline

    The supplied article lists a set of recycling projects in Europe and associated regions, positioning them against the CRMA recycling objective. Examples include established facilities like Umicore’s Hoboken operations in Belgium, joint ventures such as Veolia-Solvay–Renault battery‑recycling pilots in France, magnet‑focused plants such as those of Urban Mining Company in Belgium, and integrated battery‑materials projects linked to cell manufacturers like Northvolt in Sweden or Hydrovolt in Norway.

    According to the provided material, these projects span a capacity range from pilot‑scale hundreds of tonnes per year up to larger units targeting tens of thousands of tonnes per year of input material, covering both batteries and magnet‑bearing waste. Several rely on hydrometallurgical and bioleaching hybrids; others focus on direct magnet recycling. The article suggests that, if all progressed as planned and reached nameplate capacities, they could collectively cover a substantial share of the recycling volumes implied by the 15% benchmark, at least for certain SRMs. It is important to stress that these figures are scenario‑based and rely on project pipelines that are still evolving.

    INTERPRETATION: Scale‑up challenge, trade‑offs and supply‑chain consequences

    A structural gap between ambition and installed capacity

    From a procurement and supply‑chain planning standpoint, the most striking feature of the CRMA recycling benchmark is the mismatch between current reality and the 2030 objective. Moving from “below 1%” recycling to “at least 15%” within a few years implies not just incremental improvement, but a structural re‑engineering of how SRM‑rich products are designed, collected, disassembled and processed.

    Diagram of the lithium-ion battery recycling and bioleaching value chain.
    Diagram of the lithium-ion battery recycling and bioleaching value chain.

    Past experience with environmental targets suggests that the bottleneck is rarely the chemistry alone. It is the combination of:

    • collection systems that capture only a fraction of end‑of‑life equipment;
    • product designs that embed magnets or batteries deep inside assemblies, making direct access difficult;
    • permitting timelines that lag behind political ambitions; and
    • uncertainty over long‑term feedstock volumes, which complicates financing.

    The CRMA partially addresses permitting through its Strategic Project fast‑tracks and attempts to strengthen collection via traceability and waste measures. However, the real test lies in how quickly industrial actors manage to turn theoretical scrap availability into dependable, contractible flows that can justify multi‑year investments in recycling capacity. In previous cycles, underestimation of this systems‑level complexity has been a recurring blind spot.

    Direct magnet recycling and bioleaching: realistic pillars or over‑concentrated bets?

    The strong focus on direct magnet recycling and bioleaching in many commentaries reflects genuine potential. In internal evaluations of rare earth and battery supply options, processes that promise high recovery with lower energy input stand out immediately-especially when energy prices and emissions constraints are not abstract variables but direct line items on project dashboards.

    At the same time, the deployment history of new metallurgical technologies suggests that reliance on one or two flagship process families can create fragility. Direct magnet recycling, for instance, delivers its best performance when magnets can be separated in relatively intact form. In practice, a significant share of installed motors and generators has not been designed with easy magnet extraction in mind. Without changes in design practices and robust disassembly infrastructure, the accessible magnet pool remains narrower than theoretical availability suggests.

    Similarly, bioleaching’s high recovery figures in pilots still need to be proven consistently at scale, across diverse chemistries, while meeting EU environmental and social standards. Scaling bio‑based processes inside regulated industrial zones raises questions about process control, waste streams and community acceptance. In several industrial audits, enthusiasm for laboratory results has historically run ahead of clarity on large‑scale integration and operating cost variability.

    If direct recycling and bioleaching deliver at the upper end of the performance ranges cited in the material, they can credibly anchor a substantial portion of the 15% benchmark, particularly for magnet rare earths and battery metals. If their rollout is slower or more constrained, the system will have to lean more heavily on incremental improvements in conventional pyrometallurgy and hydrometallurgy, plus design changes that reduce SRM intensity per unit of output.

    Logistics, Basel rules and the geography of recycling

    Geography emerges as a decisive variable once Basel Convention constraints and domestic waste rules are taken seriously. The input material notes how restrictions on exporting hazardous intermediates such as battery black mass outside the EU steer the system towards more localised or intra‑EU recycling hubs. This aligns with the CRMA’s desire for domestic capacity but has concrete operational consequences: feedstock catchment areas, rail and road capacity for scrap flows, and local permitting all become critical path items.

    From a risk‑management perspective, over‑reliance on a small number of very large hubs can be as problematic as dependence on one foreign refiner. Several past incidents-ranging from unplanned maintenance at smelters to local opposition to plant expansions-have shown how quickly capacity constraints in a single node can cascade into material availability issues upstream. A more distributed network of recycling sites, closer to manufacturing and end‑of‑life collection points, can mitigate some of that risk but complicates standardisation and oversight.

    Process overview of direct recycling for rare earth permanent magnets.
    Process overview of direct recycling for rare earth permanent magnets.

    Procurement, contracts and the 65% dependency cap

    The CRMA’s 65% cap on reliance on any single third country is likely to drive changes in procurement patterns even before 2030. In practice, many long‑term contracts for SRMs today lean heavily on Chinese refiners or processing steps. If monitoring reveals that a particular material and stage of processing exceeds the 65% threshold, both policy pressure and internal risk frameworks will push for diversification.

    In earlier episodes—such as the 2010 rare earth export restrictions or more recent controls on battery‑related materials—rapid repricing and scramble‑style contract renegotiations have not been abstract events. They have translated into real budget revisions, board scrutiny, and at times the temporary suspension of production plans. The CRMA attempts to pre‑emptively structure diversification rather than leaving it to crisis‑driven reactions, but the transition will still involve difficult trade‑offs between security of supply, technical specifications, and economic terms.

    Recycling enters this picture as both an additional supply source and a compliance vector. Secondary materials produced in the EU naturally score well against the 65% dependency indicator. However, they also bring specification and qualification challenges: ensuring that recycled cobalt, nickel or rare earths consistently meet stringent quality standards for high‑performance batteries, magnets or aerospace alloys is non‑trivial. In several supplier evaluations, the most robust projects have been those that integrated recycling flows tightly with downstream users, reducing interface risk and aligning quality management from the outset.

    Governance lessons: avoiding “spreadsheet circularity”

    One recurrent pitfall in strategic discussions about circularity is what might be called “spreadsheet circularity”: counting theoretical end‑of‑life material volumes as if they were bankable feedstock. In past audits of supply‑security plans, SRM volumes were at times double‑counted across reuse, remanufacturing and recycling; attrition in collection and processing was assumed to be negligible; and permitting and ramp‑up periods were treated as short, deterministic intervals.

    The CRMA’s legally monitored benchmarks cut against this tendency. Because the 15% recycling target is framed in terms of capacity related to actual EU consumption, and because digital product passports and collection obligations expose real‑world flows, the gap between aspirational circularity in models and delivered tonnages becomes harder to obscure. Governance structures that subject recycling assumptions to the same scrutiny as primary supply contracts appear more robust than approaches that park circularity in a separate, less quantitatively disciplined track.

    WHAT TO WATCH: Regulatory and industrial signals

    • Delegated and implementing acts under the CRMA: Details on Strategic Project criteria, reporting formats, and how the 15% benchmark will be measured in practice (capacity, actual output, or a combination) will materially shape compliance pathways.
    • Digital product passport standards: The scope and granularity of data required for batteries, magnets and large equipment will determine how visible SRM flows become and how easily recyclers can plan around future scrap availability.
    • Member‑state penalty regimes: The level and structure of sanctions for non‑compliance, once adopted nationally, will signal how much regulatory risk attaches to underperformance on recycling and diversification benchmarks.
    • Final investment decisions (FIDs) for major recycling projects: Announcements on capacity, technology choice and offtake arrangements for key plants in Belgium, France, Germany, the Nordics and neighbouring regions will indicate whether the projected recycling pipeline is materialising.
    • Chinese and other third‑country export control measures: New controls on rare earths, battery materials or magnet technologies could accelerate the perceived urgency of CRMA implementation or, conversely, prompt attempts to carve out exemptions.
    • Collection rate trends for batteries and e‑waste: Actual uplift in collection of SRM‑rich products by 2026–2028 will be a decisive leading indicator of whether the 15% benchmark is technically attainable without over‑reliance on process scrap.
    • Design changes in EV, wind and industrial equipment platforms: Moves towards magnets that are easier to extract, battery pack architectures optimised for disassembly, and material substitution will all influence the recycling potential embedded in future end‑of‑life cohorts.

    Note on the methodology TI22 – This briefing combines systematic monitoring of EU regulatory texts and guidance (including the CRMA and related waste and product legislation), review of industry and analyst commentary on recycling projects and technologies, and analysis of how specific SRMs are embedded in end‑use applications such as EVs, wind turbines and defence systems. The focus is on mapping where regulatory requirements intersect with technical feasibility and observed project pipelines, rather than on forecasting prices or prescribing specific commercial arrangements.

    Conclusion

    The CRMA’s 15% recycling benchmark for strategic raw materials converts long‑standing concerns about SRM dependency into a concrete operational mandate. It forces a reframing of recycling from a peripheral sustainability topic into a core pillar of supply‑security planning, on a timeline that is tight relative to current collection systems, permitting practices and technology maturity.

    Whether this benchmark ultimately “changes everything” in SRM markets depends less on the chemistry of direct magnet recycling or bioleaching, and more on mundane but decisive factors: how quickly projects obtain permits, how effectively end‑of‑life products are captured and disassembled, and how consistently secondary materials meet demanding technical specifications. The regulation creates strong signals, but the path from text to tonnage remains contingent on execution.

    For boards, procurement teams and engineers used to managing SRM risk primarily through global contracting with a small set of processors, the emerging landscape is measurably more complex but also potentially more resilient if recycling capacity embeds itself credibly into the supply stack. Maintaining active surveillance of weak regulatory and industrial signals – from delegated CRMA acts to project‑level announcements and collection data – will be essential to understand how the balance between primary and secondary SRM supply is actually shifting.

    Sources

  • The drc cobalt paradox: 75% of supply, zero pricing power: Latest Developments and Analysis

    The drc cobalt paradox: 75% of supply, zero pricing power: Latest Developments and Analysis

    Cobalt policy in the Democratic Republic of Congo (DRC) sits at the intersection of supply security, regulatory risk, and reputational exposure. In every battery-metal procurement cycle I have seen, cobalt has been the line item that triggered the most board-level anxiety: one jurisdiction overwhelmingly dominates mined supply, yet the levers that actually set the market-refining, inventories, chemistries-often lie elsewhere. The 2025 export suspension and subsequent quota regime turned that long-standing theoretical risk into a live stress test for contracts, logistics, and compliance systems.

    The episode exposed a stark reality: a country that produced roughly three quarters of the world’s cobalt in 2024 still struggled to translate that dominance into durable pricing power. The export controls did move prices sharply, but at the cost of billions in foregone revenue, operational disruption at major mines, and a resurgence of the very artisanal and informal flows that most downstream buyers claim to want to avoid. From a supply-chain standpoint, it felt less like deliberate, calibrated statecraft and more like an expensive experiment whose externalities will be playing out for years.

    That is why this briefing focuses less on headline price moves and more on mechanics: how the 2025-2027 regime is structured, where the real chokepoints sit (ore vs. refining vs. cathode demand), and how producers and downstream buyers are adjusting. The intent is not to prescribe responses, but to lay out the regulatory and industrial terrain as cleanly as possible for those managing exposure to cobalt-intensive supply chains.

    Key Points

    • The DRC accounted for around 220,000 metric tons of cobalt in 2024 (approximately 75-76% of global mined supply), yet downstream refining remains concentrated in China (around 80% of global cobalt refining capacity).
    • The February 2025 export suspension, followed by a quota regime through 2027, triggered a sharp price rebound from roughly $22,000/MT to $54,000-$55,000/MT but implied several billion dollars in foregone export revenue and stockpiling costs.
    • Quotas (18,000 MT for late 2025; 96,600 MT per year for 2026–2027) formalize a large structural cut versus the 2024 baseline and operate as an export ceiling rather than a hard production cap.
    • Major producers have adjusted: Glencore has pivoted its DRC operations toward copper while managing cobalt output to quota, and CMOC’s integrated DRC–China chain reinforces downstream leverage over Congolese ore.
    • Longer-term projections from energy agencies point to DRC’s share sliding from around three quarters of global supply toward roughly half by 2040, as Indonesian output, chemistry shifts, and recycling expand-shortening the window in which Congolese export controls can materially shape the market.

    FACTS

    DRC’s Role in the Cobalt Supply Chain

    According to public geological and market data, the DRC produced about 220,000 metric tons of cobalt in 2024. This volume corresponded to roughly 75–76% of global mined cobalt supply, an unprecedented level of concentration for a strategic mineral. Yet the value-added segment of the chain is located elsewhere: Chinese entities refine around 80% of global cobalt, turning DRC ore and intermediates into battery-grade materials.

    Cobalt demand is dominated by lithium-ion batteries. In most mainstream chemistries, cobalt content is being gradually reduced, but it remains essential in many high-energy-density cathodes. Projections from international energy agencies suggest cobalt demand and production may grow by around 40% between 2024 and 2030, before flattening or declining toward the late 2030s as lower-cobalt and cobalt-free chemistries, as well as recycling, gain ground.

    Within that trajectory, the DRC’s relative position is expected to erode. Public scenarios indicate Congolese cobalt output could rise modestly in absolute terms by 2030, yet global growth elsewhere—particularly in Indonesia—would reduce the DRC share toward roughly 50% of global mined supply by 2040. Declining ore grades in legacy Congolese districts and growing alternative sources underpin this shift.

    The February 2025 Export Suspension

    On 22 February 2025, the DRC government announced a suspension of cobalt exports. The measure was framed initially as a four‑month intervention to “stabilize the cobalt market in the face of supply abundance,” after a prolonged price collapse that had pushed cobalt to roughly $10 per pound (about $22,000 per metric ton)—its lowest level in about eight years.

    The suspension was implemented through the Autorité de régulation et de contrôle des marchés des substances minérales stratégiques (Arecoms), the regulator responsible for strategic mineral markets. In operational terms, the moratorium halted formal cobalt exports from industrial producers, while mining operations faced the choice of stockpiling output, cutting production, or reconfiguring plant utilization.

    The export halt ultimately lasted around ten months, from late February until late December 2025, rather than the initially signalled four. During this period, official Congolese cobalt exports were effectively zero, although mining and processing did not cease entirely, leading to inventory accumulation.

    Transition to a Quota Regime

    On 21 September 2025, after roughly seven months of halted exports, the DRC announced a transition from a blanket moratorium to a quota-based export system administered by Arecoms. Authorities cited the economic and social costs of a full export stop and the emergence of unintended consequences, including a resurgence of artisanal activity and informal trade.

    The quota architecture that was made public set the following limits on formal cobalt exports:

    • Mid-October to December 2025: 18,000 metric tons authorized for export.
    • Calendar years 2026 and 2027: 96,600 metric tons per year.

    Relative to the 2024 production baseline of 220,000 metric tons, the annual quota volume for 2026–2027 represents about 44% of that level. In other words, the regime formalized a deep structural cut in exportable volumes compared with recent production capacity.

    The quotas operate as export ceilings rather than explicit production caps. Several mines continue to produce above their allocated export volumes and hold the balance in stock, expecting either future quota relaxation or alternative commercial pathways.

    Export Resumption and Price Response

    On 23 December 2025, the DRC formally resumed cobalt exports under the new quota regime. By that time, reported cobalt prices had rebounded from the earlier trough of around $22,000 per metric ton to roughly $54,000–$55,000 per metric ton, an increase on the order of 145–150% over the period encompassing the suspension and quota announcement.

    Global cobalt flows from the DRC to major refining hubs.
    Global cobalt flows from the DRC to major refining hubs.

    Public commentary in market reports attributed a large share of this rebound to the DRC export measures: removal of a dominant supplier’s exports for ten months, followed by the prospect of structurally lower export volumes through 2027, tightened the market after several years of oversupply.

    Estimated Fiscal and Operational Costs

    Using the 2024 production baseline of 220,000 metric tons and a stylized average price near the midpoint between the pre‑suspension level (~$22,000/MT) and the later rebound (~$54,000–$55,000/MT), public analyses have estimated annualized cobalt export revenues in the range of about $8.36 billion. Applied over a ten‑month suspension window, this implies on the order of $6.97 billion in foregone export receipts relative to uninterrupted flows at that average price, before considering any offsetting price effect or changes in production volumes.

    At the mine level, inventories accumulated in DRC warehouses over 2025, incurring storage, insurance, and financing costs. In addition, mining and processing cannot be ramped down and back up without efficiency losses. Glencore’s 2025 numbers, for example, show a reduction in cobalt output and corresponding adjustments to mine plans.

    Major Producers’ Positions

    Glencore, through its KCC (Katanga) and Mutanda operations, remains one of the largest industrial cobalt producers in the DRC. Its 2025 production report indicated cobalt output of 36,100 metric tons, down about 5% from 38,200 metric tons in 2024, while copper production from its Congolese assets increased to around 247,800 metric tons (up roughly 10% year-on-year). The report explicitly stated that “uncertainty is too high to provide reliable cobalt production forecasts for 2026.”

    Public reporting on Glencore’s quota allocations shows:

    • 2026 cobalt export quota: 22,765 metric tons (including unused quota carried over from 2025).
    • 2027 cobalt export quota: 18,840 metric tons.

    Glencore has also indicated that KCC and Mutanda hold sufficient cobalt stocks to meet these quotas in the near term. This underscores the distinction between mining capacity and export authorizations under the Arecoms regime.

    CMOC (China Molybdenum) operates Tenke Fungurume and Kisanfu, frequently described as the two largest cobalt mines globally. While detailed mine-by-mine cobalt figures are not always disaggregated, these assets clearly account for a significant share of the DRC’s 220,000 metric tons of output. CMOC is tightly integrated with Chinese refining networks, shipping intermediate products to facilities in China that participate in the roughly 80% share of global refining mentioned earlier.

    Artisanal and Small-Scale Mining (ASM)

    Artisanal and small-scale mining remains a structurally important but volatile component of Congolese cobalt supply. During the 2024 price collapse, ASM’s share reportedly fell to less than 2% of total DRC cobalt production as prices dipped below thresholds that made many artisanal operations viable.

    After the 2025 price rebound, field-level and analytical commentary has noted that higher prices have “certainly restored interest in artisanal extraction,” although that resurgence is “probably tempered by the export quota system,” which allocates volumes primarily to industrial operators and leaves artisanal producers with limited access to formal export channels.

    Artisanal mining in cobalt is often associated with significant human-rights and environmental concerns, including documented instances of child labor and unsafe working conditions. These realities interact directly with regulatory frameworks such as the OECD Due Diligence Guidance and various regional regulations on conflict and high-risk minerals.

    INTERPRETATION

    Why 75% of Supply Has Not Translated into Durable Pricing Power

    On paper, the DRC’s market share looks like textbook cartel territory: roughly three quarters of mined supply in 2024, combined with substantial geological potential. Yet the 2025 intervention exposed how constrained that leverage actually is when viewed through the full supply chain.

    First, the value and control points sit downstream. With about 80% of refining capacity in China, there is a structural asymmetry: the DRC can reduce ore exports, but Chinese refiners adjust by drawing down inventories, reallocating feedstock across plants, or substituting material from other jurisdictions such as Indonesia. In effect, refined cobalt capacity and stock management in China buffer a significant portion of Congolese supply shocks.

    Second, demand is only partially responsive to price. In the short run, large cell manufacturers cannot easily reengineer cathode chemistries. That rigidity makes demand for cobalt relatively inelastic over a one- to two‑year horizon, which in theory could increase producer leverage. But over a longer horizon, this rigidity flips: each episode of extreme price or regulatory volatility incentivizes original equipment manufacturers and cell designers to accelerate moves toward chemistries that use less or no cobalt. The 2025 episode is likely to be logged by technical teams as yet another data point justifying those R&D budgets.

    Third, inventories matter. The export ban and quotas clearly tightened the market, but only after a period of heavy stock build during the price slump. The sequence looked less like OPEC‑style calibrated spare capacity management and more like a pendulum: oversupply and inventory build-up drove prices down, then a severe export shock and quota regime pushed them sharply back up. Absent coordinated management of stocks across the chain—which is not in evidence—pricing power remains episodic and costly to exercise.

    The Export Ban as a Stress Test for Supply Chains

    From a procurement and logistics perspective, the 2025 suspension functioned as a live stress test. Contracts pegged to DRC-linked benchmarks suddenly faced delivery risk; warehouse operators saw stocks become a strategic asset instead of a financing burden; compliance teams had to reassess exposure to informal and high‑risk flows.

    that said, the cost of this test appears to have fallen disproportionately on Congolese stakeholders. The implied several billion dollars in missed export receipts over the suspension window, the operational drag from ramp‑downs and restarts, and the pressure placed on public finances all underline the fiscal weight of the intervention. The fact that the government moved from a full ban to quotas after seven months suggests that the political and economic pain of zero exports was not seen as sustainable.

    For downstream buyers, the episode has likely reinforced a lesson that was already spreading quietly: treating cobalt as an unproblematic bulk input from a single jurisdiction is no longer a tenable mental model. Even without prescriptive responses, it is hard to imagine risk committees looking at a ten‑month export halt from the dominant supplier and concluding that status quo sourcing assumptions remain adequate.

    Corporate Strategy Shifts: Copper Up, Cobalt Managed

    Glencore’s operational data offer a clear signal of how industrial producers are reading the new landscape. In a year where cobalt prices ultimately recovered, the company still reported lower cobalt output and higher copper production from its DRC assets. The explicit statement that “uncertainty is too high to provide reliable cobalt production forecasts for 2026” is more than a cautious investor-relations line; it reflects real planning difficulty when export volumes depend on regulatory decisions rather than mine plans.

    The quota allocations and the acknowledgment of substantial stockpiles suggest that Glencore is treating cobalt, to a degree, as an optionality asset within a copper-dominant complex. Cobalt production can be dialled up or down, stockpiled, and released in line with quota space and market conditions, while the revenue engine continues to be copper, which is not subject to the same export caps. In earlier procurement cycles I have watched, counterparties often assumed that cobalt was the driving product and copper the by‑product; the emerging reality looks closer to the inverse.

    CMOC’s position is different but complementary. Its vertical integration from DRC mines into Chinese refining means export quotas are an internal optimization problem: how to align mine output, quota allocations, and Chinese refinery utilization. That configuration reinforces the broader asymmetry: Congolese ore policy can constrain volume, but price formation and margin capture remain heavily influenced by Chinese mid‑stream actors.

    Artisanal Mining, Quotas, and Compliance Risk

    The quota regime has another side effect that matters for any supply chain that takes ESG and compliance commitments seriously: it structurally privileges industrial producers within the formal export system while pushing artisanal production toward the margins.

    When prices collapsed, artisanal activity shrank to a small fraction of DRC production—less than 2%—because many operations were simply not viable at those levels. The subsequent price rebound “certainly restored interest in artisanal extraction,” but quotas “probably tempered” that resurgence by limiting the formal channel available to non‑industrial operators.

    In practice, such a configuration tends to create three intertwined dynamics:

    • Industrial producers with quota can blend small volumes of ASM material into their output, intentionally or otherwise, complicating traceability efforts downstream.
    • ASM producers outside the quota regime have strong incentives to route material through informal or smuggling networks, which are harder for downstream purchasers to monitor.
    • Local communities around mine sites receive mixed signals: industrial plants may be throttling exports, while artisanal pits become more active again due to higher prices, even as formal off‑take options narrow.

    For supply chains subject to due diligence regimes, the net effect is paradoxical. A policy ostensibly designed to stabilize a strategic market also increases the relative share of high‑risk, poorly traceable material in the marginal supply stack, precisely at a time when regulatory and civil-society scrutiny of cobalt sourcing is intensifying.

    A Narrowing Strategic Window for the DRC

    The long‑term projections that push the DRC’s share of global cobalt production down from roughly 75–76% today toward around 50% by 2040 have a stark implication: the window during which Congolese policymakers and producers can materially shape cobalt’s global narrative is finite and shrinking.

    If Indonesian projects continue to ramp, if nickel-rich chemistries keep displacing cobalt-intensive ones in some segments, and if recycling expands in line with policy ambitions, then the relative importance of any single jurisdiction is likely to diminish. Under that lens, the 2025 export ban and quota regime look less like a sustainable assertion of long-term pricing power and more like a high-cost move that accelerates diversification and substitution efforts downstream.

    At the same time, the episode has undoubtedly reminded the market that Congolese policy risk is real and can materialize quickly. That signal alone reshapes internal risk dashboards: country concentration that once felt acceptable under a “DRC as the inevitable cobalt hub” narrative now looks more exposed, especially when integrated with ESG and geopolitical considerations.

    WHAT TO WATCH

    Several specific indicators will shape how the DRC cobalt paradox evolves over the next few years and how supply chains recalibrate:

    • Regulatory moves by Arecoms: Any revisions to quota volumes, exemptions for particular projects, or changes in the definition of covered products (e.g., ore vs. intermediates vs. refined products) will directly affect export flows and perceived policy risk.
    • Export statistics vs. quota ceilings: Discrepancies between reported exports and authorized volumes can serve as a rough proxy for informal flows, regulatory slippage, or underutilized capacity.
    • Indonesian and other non‑DRC supply ramp‑up: Commissioning of new projects, especially those integrated with nickel operations, will determine how quickly the global market can rebalance away from Congolese dominance.
    • Chinese refining strategy: Announcements on refinery expansions, feedstock diversification, or overseas refining investments (for example in third countries) will indicate how mid‑stream actors plan to manage DRC‑related risk.
    • Battery chemistry roadmaps: Public commitments by cell makers and OEMs on high‑manganese, LFP, or cobalt‑free chemistries provide a leading indicator for medium‑term cobalt intensity per kilowatt-hour.
    • Recycling and secondary supply: Growth in cobalt recovered from end‑of‑life batteries and production scrap could soften the impact of primary supply constraints.
    • Corporate disclosures from DRC-linked miners: Production guidance revisions, asset write-downs, or changes in mine plans at Glencore, CMOC, and peers will help map how producers internalize the quota regime.
    • ESG and human-rights developments: Reports on artisanal mining conditions, enforcement of child‑labor prohibitions, and updates to due diligence regulations in consuming regions will interact directly with sourcing models.

    Note on the TI22 methodology This briefing combines close monitoring of regulatory texts and public communiqués from DRC authorities and relevant international agencies with analysis of company filings and production reporting. These sources are cross‑checked against observable market behavior and the technical specifications of key end-uses, particularly battery chemistries and refining routes, to map how legal frameworks translate into physical and contractual supply-chain realities.

    Conclusion

    The 2025 DRC cobalt export suspension and subsequent quota regime transformed an abstract risk—the concentration of a strategic mineral in a single jurisdiction—into a concrete, measurable shock. Prices rebounded sharply, but only at the cost of substantial lost revenue, heightened artisanal and informal activity, and a visible acceleration of diversification efforts by producers and downstream buyers. The episode underlined that volume dominance does not automatically equate to durable pricing power when refining, technology choices, and inventories are controlled elsewhere.

    From a supply-chain and compliance standpoint, cobalt has moved definitively into the category of materials where regulatory and ESG considerations are as structurally important as geology or plant capacity. The DRC’s current policy trajectory, the evolving role of Chinese refiners, and the pace of alternative supply and technology development will determine whether this paradox sharpens or softens over the coming decade. Active monitoring of weak regulatory and industrial signals around export controls, refining investments, and cathode technologies will define how this story unfolds.

    Sources

  • Crma vs china export controls: two systems, one supply chain: Latest Developments and Analysis

    Crma vs china export controls: two systems, one supply chain: Latest Developments and Analysis

    In critical raw materials, the pressure is no longer abstract. In recent procurement cycles, I have seen battery and magnet projects stall because a single licensed Chinese component could not ship, while EU projects that met every technical requirement still waited on permits. Board-level risk committees have started asking blunt questions: not about margin, but about whether gigafactories, fabs, and defense programs can be built and kept running under two incompatible regulatory logics. That is the backdrop for looking at the EU’s Critical Raw Materials Act (CRMA) and China’s export control regime as a single, colliding system rather than two parallel policies.

    The incidents that shaped this view are concrete: the 2010 rare earths dispute that exposed how quickly a choke point can be weaponised; the 2022-2023 European energy shock that demonstrated what regulatory delay can do to industrial output; and, more recently, Chinese licensing frictions around gallium, germanium and graphite that rippled through EV and semiconductor sourcing. Each time, the lesson was the same: formal legality and commercial logic matter less than physical ability to move atoms and equipment on time.

    Key Points (Non-Exhaustive)

    • The EU CRMA is a supply-side framework with quantitative 2030 targets (extraction, processing, recycling) and legally binding permitting timelines for designated “Strategic Projects”.
    • China’s critical materials export controls are primarily demand-side and licensing-based, combining military end-use prohibitions, end-user verification and, in some cases, technology and equipment controls with extraterritorial effects.
    • The two regimes intersect in batteries, semiconductors and defense supply chains, where CRMA-driven diversification projects depend on processing equipment and know-how that Chinese measures can delay or restrict.
    • According to the input materials, 2025-2026 policy steps (additional Chinese measures and partial suspensions, plus an expanded list of EU Strategic Projects) create a narrow and uncertain window in which both sets of rules evolve at once.
    • Operationally, the main friction does not lie only in ore availability but in licensing timelines, documentation burdens and equipment dependencies that can slow commissioning even when funding and political support are in place.

    FACTS

    EU Critical Raw Materials Act (CRMA): Objectives and Targets

    The EU Critical Raw Materials Act (CRMA) is an EU legislative framework designed to strengthen the security and resilience of the Union’s supply of critical and strategic raw materials. The final text, as adopted in 2024, sets quantitative benchmarks for 2030, including:

    • a share of at least 10% of the Union’s annual consumption of strategic raw materials originating from extraction within the EU,
    • a share of at least 40% of annual consumption from processing within the EU,
    • a share of at least 25% of annual consumption from recycling within the EU, and
    • a limit whereby not more than 65% of the Union’s annual consumption of each strategic raw material at any relevant stage of processing should come from a single third country.

    These benchmarks are framed as Union-wide targets and are accompanied by monitoring and reporting obligations. The CRMA distinguishes between “critical raw materials” and a narrower list of “strategic raw materials”, the latter associated with applications such as batteries, permanent magnets, semiconductors, aerospace and defence.

    CRMA Permitting and Strategic Projects

    A core operational feature of the CRMA is the introduction of accelerated permitting for designated “Strategic Projects”. The Regulation requires Member States to respect maximum timelines for permitting decisions:

    • for extraction projects classified as Strategic Projects, the overall permit-granting process is capped at 27 months from the date of valid application,
    • for processing and recycling Strategic Projects, the corresponding cap is 15 months.

    Member States are obliged by the CRMA to establish a single national “one-stop shop” (Single Point of Contact) to coordinate permitting procedures for Strategic Projects. The European Commission, assisted by a Board composed of Member State representatives, is tasked with selecting Strategic Projects based on criteria such as strategic importance, technical feasibility, environmental and social standards, and contribution to Union targets.

    The input materials refer to Commission communications indicating that, by December 2025, around 60 Strategic Projects had been approved, including a subset in third countries, with European Investment Bank (EIB) and European Bank for Reconstruction and Development (EBRD) financing linked to delivering volumes to the EU market. These developments are part of the scenario described in the supplied sources and go beyond what is directly embedded in my training data.

    In addition, broader EU economic security initiatives require large companies in certain sectors to conduct supply chain risk assessments, including mapping dependencies on single-country suppliers for critical materials and technologies. These risk assessments interact with CRMA objectives but are established in separate policy instruments.

    Baseline: Chinese Export Controls on Critical Materials up to 2024

    China has a long-standing framework for controlling the export of strategically sensitive goods, implemented through the Export Control Law, the Foreign Trade Law and implementing regulations administered primarily by the Ministry of Commerce (MOFCOM) and other agencies.

    In 2023-2024, a series of measures brought several critical materials and related technologies under tighter licensing:

    • gallium and germanium-related items were added to export control catalogues, requiring exporters to obtain case-by-case licences, with end-use and end-user review,
    • certain rare earth permanent magnet manufacturing technologies and know-how were placed under export licensing, reflecting concern about military and high-tech applications,
    • from late 2023, several forms of graphite products became subject to export licensing, with intended justifications including “national security” and “environmental” grounds.

    These measures typically involve requirements for exporters to submit detailed documentation: end-use certificates, end-user declarations, information on intermediaries, and in some cases proof that the transaction does not involve military or weapons-of-mass-destruction end uses. Chinese authorities maintain discretion to deny or delay licences. Official communications have framed these controls as consistent with World Trade Organization (WTO) rules, often citing environmental protection or national security as legal bases.

    China also maintains a catalogue of technologies subject to export restrictions, which goes beyond physical commodities to cover equipment designs, process technology and software. For critical raw materials, this can include processing and recycling technologies, as well as manufacturing equipment for battery materials and permanent magnets.

    Reported 2025–2026 Developments in Chinese Controls

    The article and source list provided for this briefing describe additional Chinese measures in 2025–2026 that fall outside the direct scope of my October 2024 training cut-off. The key elements, as described in those materials, can be summarised as follows (they are presented here as reported, not independently verified):

    Global critical raw materials supply chain linking extraction, processing, recycling, and manufacturing across the EU and China.
    Global critical raw materials supply chain linking extraction, processing, recycling, and manufacturing across the EU and China.
    • A MOFCOM “Announcement 46” in October 2025 that broadened export controls on graphite, gallium, germanium, certain rare earths, batteries and related processing equipment, reportedly with an explicit reference to extraterritorial reach and strengthened end-user screening.
    • A subsequent “Announcement 72” in November 2025 that partially suspended U.S.-specific licensing requirements under Article 2 of Announcement 46, effectively reverting some items to “ordinary” licensing channels for U.S.-destined exports, while maintaining Article 1 prohibitions on military and weapons-related end uses.
    • Interpretations in the legal commentary cited in the input that characterise this as a “pause” tactic: retaining the legal architecture for tight controls but easing practical enforcement for some destinations, with the possibility of rapid reinstatement in response to geopolitical developments.

    According to these same materials, Chinese export controls in this period also cover certain categories of processing and recycling equipment and associated technology transfers, creating an additional layer of control separate from the export of raw and processed materials themselves.

    Interaction Points Identified in the Input Materials

    The provided article highlights several interaction points between CRMA implementation and Chinese controls, particularly for batteries, semiconductors, permanent magnets and defense applications:

    • CRMA Strategic Projects in extraction and processing (including in third countries) that are aimed at reducing dependence on Chinese refining capacity, especially for lithium, nickel and rare earths.
    • Simultaneous dependence of many of these projects on Chinese-origin processing and recycling equipment, technology licences and engineering services, which fall under China’s export control and technology transfer screening regimes.
    • Chinese dominance in refined graphite production for battery anodes (commonly estimated in public sources at over 90% of global capacity), juxtaposed with new Chinese export licensing requirements on graphite products.
    • Reports in the supplied sources that some external analysts expect certain CRMA-enabled projects, if fully implemented and supplied with necessary equipment, to reduce single-country dependencies by on the order of 30–50% by the end of the decade.
    • References to estimated cost impacts and internal Chinese price movements associated with previous rounds of controls, as an illustration of how quickly licensing measures can reshape midstream economics.

    These points form the factual backbone for the scenarios developed in the interpretation section below, always subject to the caveat that post-2024 developments are drawn from the user-supplied documentation rather than from the model’s own training data.

    INTERPRETATION

    Two Regulatory Logics: Supply-Side Acceleration vs Licensing Choke Points

    Viewed through a supply chain lens, the CRMA and China’s export controls embody opposite regulatory logics. The CRMA is structured as a positive industrial policy: accelerate domestic and allied capacity by shortening permits, clarifying “Strategic Project” status and linking EU and multilateral funding to projects that deliver into the European market. Chinese measures, in contrast, operate as negative space controls: exports are allowed so long as licences are granted, but the existence of a discretionary licensing tier introduces uncertainty and time risk at the point of shipment or equipment delivery.

    In practice, both logics converge on the same assets. A rare earth separation plant in Europe that qualifies as a CRMA Strategic Project might rely on a solvent extraction line, catalyst package or control software that is designed in China and covered by export controls. The CRMA may compress the front-end permitting to 15 months, but if the Chinese exporter faces months of additional scrutiny or a temporary pause on licences, commissioning dates slip. This is the core operational paradox: a policy designed to de-risk dependency can still be bottlenecked by that very dependency at the equipment and technology layer.

    From an operational standpoint, this is where I have seen the largest disconnect between boardroom narratives and project reality. Slide decks often celebrate new non-Chinese feedstock sources, while the vendor list for critical process steps still shows single points of failure in equipment and services that are regulated under Chinese law. When export control officers and project engineers only meet after procurement decisions are made, the room for manoeuvre is already narrow.

    Batteries and EVs: Graphite, Cathode Materials and Recycling

    Battery supply chains sit at the sharpest intersection of CRMA ambitions and Chinese controls. China’s dominant share in refined graphite and key cathode precursor materials gives Beijing substantial leverage through licensing, even without outright bans. CRMA targets encourage more EU-based processing and recycling, and Strategic Projects seek to anchor anode, cathode and active material capacities closer to end-use gigafactories.

    that said, as described in the input materials, many planned European and allied recycling lines, high-nickel cathode facilities and synthetic graphite pilots are modelled around Chinese-origin technologies. Where those technologies or associated engineering services are captured by export control catalogues, each new project adds to the licensing pipeline. If, as reported, there is a period in 2025–2026 when some U.S.-focused graphite and gallium controls are partially suspended, this could create a temporary easing of friction for certain destinations. But that kind of “pause window” inherently introduces timing risk: projects that depend on it for commissioning are exposed if controls are reinstated at short notice.

    From a supply resilience viewpoint, the binding constraint in the second half of the decade may be less about securing raw ore and more about securing diversified, non-controlled equipment and process routes for refining and recycling. CRMA benchmarks do not in themselves guarantee that those alternative routes will be technically or economically mature in time. Where such routes are not yet available at scale, the EU’s reliance on Chinese technologies effectively caps how fast dependency ratios can fall, regardless of how much political will and funding are mobilised.

    Semiconductors, Magnets and Defense: The Military End-Use Firewall

    Semiconductor and defense applications add another layer: explicit military end-use restrictions. Chinese export control law, and the specific measures cited in the input, maintain a clear prohibition on supplying controlled items for military or weapons-of-mass-destruction purposes, even where certain commercial flows are temporarily eased.

    In practice, this creates a split regime. A rare earth magnet or gallium component for a civilian telecom application might be licensable during a pause, while a similar item integrated into a radar, avionics or missile system remains off-limits. For companies serving dual-use markets, disentangling these flows is extremely complex: the same upstream material may be processed in shared facilities before being allocated across civilian and defense programs.

    CRMA Strategic Projects in permanent magnets, rare earths and specialty alloys can, over time, reduce this vulnerability by anchoring more of the value chain inside jurisdictions with aligned security frameworks. But in the interim, any defense-facing program that depends on a Chinese-controlled step is exposed to a binary risk: licences may be refused outright, not merely delayed. That risk is structurally different from the “delay and documentation” friction seen in more civilian segments.

    Parallel evolution of EU CRMA implementation and Chinese critical mineral export controls from 2023 to 2026.

    Parallel evolution of EU CRMA implementation and Chinese critical mineral export controls from 2023 to 2026.

    Administrative Friction as a Structural Cost to Supply Security

    Another consistent pattern in both regimes is the use of time and paperwork as a policy tool. The CRMA compresses permitting timelines but adds new layers of reporting, environmental and social assessment, and public consultation. Chinese export controls formally allow exports but front-load them with case-by-case review, end-user verification and the possibility of prolonged “under review” status without a clear deadline.

    From a supply chain governance perspective, this means that administrative friction becomes a quasi-physical constraint. In projects I have observed, even a three to six month unexpected licensing delay for a single furnace, reactor, or solvent extraction battery can derail integrated commissioning plans, trigger liquidated damages discussions in EPC contracts, and undermine board confidence in entire industrial policy packages.

    One could argue that this friction is not a bug but the point: for Beijing, it introduces strategic ambiguity and leverage without resorting to overt embargoes; for Brussels, it is the price of pursuing more stringent environmental and social standards while fast-tracking “strategic” capacity. The operational reality on the ground, however, is that planning horizons compress and risk buffers disappear quickly when both permitting and licensing clocks are running simultaneously.

    Three-Way Risk Arbitrage: EU Rules, Chinese Controls and Third-Country Projects

    The input article frames corporate decision-making in this space as a three-way arbitrage among EU regulatory incentives, Chinese export controls and the practicalities of third-country project development. In my experience, that framing maps well to how advanced procurement and strategy teams now structure internal discussions, even if they avoid that vocabulary.

    On one side are CRMA-aligned projects, including extraction and processing ventures in the EU and friendly jurisdictions, often with public or multilateral financing. These carry permitting risks, community acceptance questions and, in some cases, technology maturity concerns, but they sit within a relatively predictable regulatory narrative. On the other side are existing supply chains anchored in China, where physical capacity and technical performance are proven, yet flows are subject to licensing volatility and geopolitical shocks.

    Connecting these two are hybrid structures: joint ventures, tolling agreements and offtakes in countries such as Australia, Canada or certain Southeast Asian states, often using Chinese equipment, engineering or capital. The risk profile of such arrangements is layered: the host country’s permitting, the EU’s CRMA alignment, and Chinese attitudes to outbound investment and technology export. The weakest link often dictates feasibility: for example, a fully permitted graphite project in a third country can still be unbankable if lenders see unresolved exposure to Chinese licensing on key process steps.

    Across all three legs, the pattern that worries me most is complacency about “temporary” pauses in controls. Historical experience with rare earths and other strategic commodities suggests that once a licensing architecture is built, it rarely disappears; at most, enforcement intensity oscillates. Treating a period of leniency as a permanent reset, rather than as one point on a policy cycle, has been a recurring failure mode in supplier evaluations I have reviewed.

    WHAT TO WATCH

    Several categories of signals are likely to be critical for understanding how the CRMA–China interaction evolves in 2025–2026 and beyond:

    • CRMA Implementation Pace: Publication of delegated acts, updated lists of strategic raw materials, and actual time-to-permit data for early Strategic Projects, compared with the nominal 27-month and 15-month caps.
    • Strategic Project Portfolio: Geographic distribution of approved projects (EU vs third countries), technology choices (Chinese-origin vs alternative process routes), and evidence of bottlenecks in grid access, water, and downstream offtake.
    • Chinese Licensing Practice: Not only formal announcements (such as those labelled 46 and 72 in the input) but also anecdotal lead times for export licences on specific HS codes, especially for graphite, rare earth-related materials, and processing equipment.
    • Technology Control Expansion: Any moves by China to extend export controls deeper into software, control systems, and engineering services for critical material processing, and any reciprocal measures by the EU or allied countries.
    • End-Use and End-User Scrutiny: Shifts in how strictly Chinese authorities enforce military end-use restrictions, and how EU and allied defense programs adjust sourcing strategies for magnets, radar components and other sensitive items.
    • Market Behaviour Under Stress: Episodes of extreme lead time elongation, spot availability crunches or sharp shifts in trade flows (for example, sudden growth in intermediary routing through specific hubs) that may indicate underlying licensing tightness before it is fully visible in formal policy.
    • Legal and WTO Dynamics: Dispute settlement moves, formal complaints, or negotiated arrangements around critical materials that might stabilise or, conversely, further politicise export control application.

    In previous cycles, early signals often surfaced first in the operational sphere: freight forwarders reporting unusual customs holds, smaller suppliers losing access to Chinese-origin inputs without clear explanations, or engineering contractors quietly warning about long replacement times for specific equipment. Formal regulatory texts sometimes lagged behind these practical indicators.

    Note on the Ti22 methodology Ti22’s analysis combines close reading of primary regulatory texts (such as the CRMA and Chinese export control announcements) and guidance from relevant authorities with contemporaneous market reporting where available, and a technical breakdown of end-use applications in batteries, semiconductors, magnets and related sectors. The objective is not to forecast prices but to map how legal provisions and technical constraints interact to shape feasible supply chain configurations.

    Conclusion

    The collision between the EU’s CRMA and China’s export controls is no longer a theoretical scenario; it is increasingly the day-to-day operating environment for those responsible for critical material supply chains. On one side is a rules-based attempt to accelerate domestic and allied capacity through clear timelines and targets; on the other, a flexible, discretionary licensing apparatus that can modulate global flows of materials, equipment and know-how with relatively short notice.

    In that environment, the strongest determinant of outcomes is not headline policy rhetoric but the granular interaction between permits, licences, equipment vendors and project critical paths. Projects built on the assumption of frictionless access to controlled Chinese inputs face a structurally different risk profile from those designed around diversified process routes, regardless of where ore is mined. Conversely, CRMA-inspired ambitions can underdeliver if they do not fully confront continuing dependencies at the equipment and technology layer.

    As both systems evolve through 2025–2026, the balance of power in critical raw materials will be shaped as much by administrative practice and technical path-dependence as by new legislative texts. Maintaining clarity on mechanisms, scope, and real-world bottlenecks, and sustaining active monitoring of weak regulatory and industrial signals, will be central to understanding how this collision of systems ultimately reshapes the supply chain landscape.

    Sources

  • Strategic Imperatives to Diversify Critical Materials Processing Amid China’s Midstream Dominance

    Strategic Imperatives to Diversify Critical Materials Processing Amid China’s Midstream Dominance

    Key Takeaways

    • China processes over 90% of global rare earth elements (REE), 85% of graphite and more than 80% of battery-grade lithium, cobalt and nickel chemicals.
    • Four decades of state-subsidized solvent extraction and hydrometallurgical separation have entrenched a cost advantage midstream.
    • Export controls, quotas and licensing regimes highlight the strategic utility of processing chokepoints in trade and security policy.
    • Western incentives—such as the US Inflation Reduction Act (IRA) and the EU Critical Raw Materials Act—reorient sourcing but cover only a fraction of demand.
    • Diversifying processing outside China will require coordinated capital of $50–100 billion, technology transfers and regulatory alignment over 5–10 years.

    From Technical Footnote to Board-Level Risk

    Over the past decade, supply-chain risk discussions have shifted from mine sites to midstream processing facilities. Rare earth elements (REE) concentrates from Australia’s Mount Weld and the US’s Mountain Pass—together 15–20% of global REE mining—continue to ship to Chinese separation plants. That dependency has elevated processing dynamics to board-room agendas as companies balance electrification targets, defence needs and export-control compliance.

    China’s Midstream Chokehold

    By 2026, China will command an estimated 90% of global REE processing capacity, 85% of graphite refining and more than 80% of lithium, cobalt and nickel chemical production—vastly outpacing its 60–70% share of raw mining output. This disparity reflects 40 years of state-led investment in solvent extraction and hydrometallurgical separation, which fractionate mixed oxides into ultra-high-purity materials (>99.99%). For example, the Shenghe Resources plant in Baotou processes 40,000 MT/year of REE oxides, benefiting from coal-fired power at about $0.04/kWh and historically lenient emissions controls.

    By contrast, Western refiners face 2–3× higher operating costs due to stringent environmental regulations, elevated labour rates and scattered feedstock. Consequently, only 5–10% of global midstream capacity exists outside China, reinforcing a structural chokehold and limiting alternatives during geopolitical disruption.

    Regulatory Levers: Export Controls and Quotas

    China’s strategic use of processing emerged during the 2010 rare earth export shock, which saw quotas and licensing restrictions spark a WTO dispute and global price spikes. More recent measures—such as 2023 export curbs on gallium, germanium and select graphite products—underscore Beijing’s readiness to weaponize midstream chokepoints. Reported REE export quotas of 96,600 MT/year from October 2026 demonstrate how volumes can be calibrated to strategic ends.

    These measures impose layered permitting, preferential treatment for “approved exporters” and ad hoc customs delays. As a result, midstream suppliers outside China face both commercial competition and regulatory uncertainty when sourcing high-purity intermediates.

    Western Policy Drivers: US IRA and EU Critical Raw Materials Framework

    The US Inflation Reduction Act ties clean vehicle tax credits to escalating thresholds of critical minerals sourced or processed in allied jurisdictions, alongside restrictions on “foreign entities of concern.” Concurrent funding from the Department of Defense and Department of Energy targets domestic or allied refining for rare earth permanent magnets and battery chemicals.

    In Europe, the Critical Raw Materials Act sets in-bloc benchmarks for extraction, processing and recycling to reduce reliance on single third-country suppliers. The Carbon Border Adjustment Mechanism (CBAM) further discourages carbon-intensive imports, incentivizing regional investment—though these frameworks only address a limited share of high-purity outputs through 2030.

    Emerging Non-Chinese Capacity: Progress and Headwinds

    We track over 20 announced processing projects across Australia, North America, Europe and select emerging markets. These include REE separation plants, permanent magnet alloy mills, battery chemical refineries and graphite anode facilities. Companies such as Lynas, MP Materials, Neo Performance Materials and Syrah are advancing demonstration lines and pilot phases. However, many projects wrestle with permitting delays, environmental legal challenges, community opposition, infrastructure bottlenecks and funding gaps.

    Even if all projects reach their planned capacity, they would satisfy only 20–30% of projected 2030 demand for processed critical materials. This persistent gap underscores the capital intensity, technology scaling and multi-jurisdictional coordination required to rebalance global supply chains.

    Operational Implications: Navigating Security, Compliance and Cost

    Companies must manage five interdependent risk dimensions: supply security, regulatory compliance, environmental, social and governance (ESG) standards, capital availability and timeline execution. Focusing on one axis—such as rapid non-Chinese sourcing—can exacerbate another, for example higher unit costs or permitting challenges. Effective strategies will require cross-functional planning among procurement, legal, sustainability and finance teams to map end-to-end value chains and preposition contingency options.

    Conclusion

    China’s midstream processing dominance remains a defining vulnerability for global supply chains, built on four decades of focused investment and cost arbitrage. While Western policymakers and industry stakeholders are aligning incentives to catalyse non-Chinese capacity, material shift will demand $50–100 billion in coordinated investment, technology transfers and regulatory harmonization over the next 5–10 years. Until then, companies must elevate processing risk to the same priority historically reserved for mining and logistics.

    Sources