Category: Market Deep Dives

Single-commodity analyses (graphite, antimony, lithium…)

  • Ndfeb magnets: the supply chain that powers the energy transition: Latest Developments and Analysis

    Ndfeb magnets: the supply chain that powers the energy transition: Latest Developments and Analysis

    **NdFeB magnets sit at the core of EV traction motors and direct‑drive wind turbines, but from 2024-2026 the mine‑to‑motor chain is defined less by geology than by processing and alloy bottlenecks. Heavy rare earth separation (Dy/Tb), ferroboron availability, and an overwhelmingly China‑centric magnet manufacturing base are setting the practical ceiling on how fast the energy and defense sectors can de‑risk supply.**

    NdFeB Magnets: The 2026 Supply Chain Behind the Energy Transition

    Neodymium‑iron‑boron (NdFeB) magnets have become the quiet infrastructure of the energy transition. High‑performance permanent magnets underpin traction motors in electric vehicles (EVs) and direct‑drive generators in wind turbines, with industry studies such as Future Markets [1] projecting that demand for NdFeB‑related rare earth oxides could roughly triple by 2035. The constraint in 2026 is not only ore availability, but the technical and geopolitical fragility of the mid‑stream: separation of heavy rare earths, ferroboron production, and magnet manufacturing concentrated overwhelmingly in China.

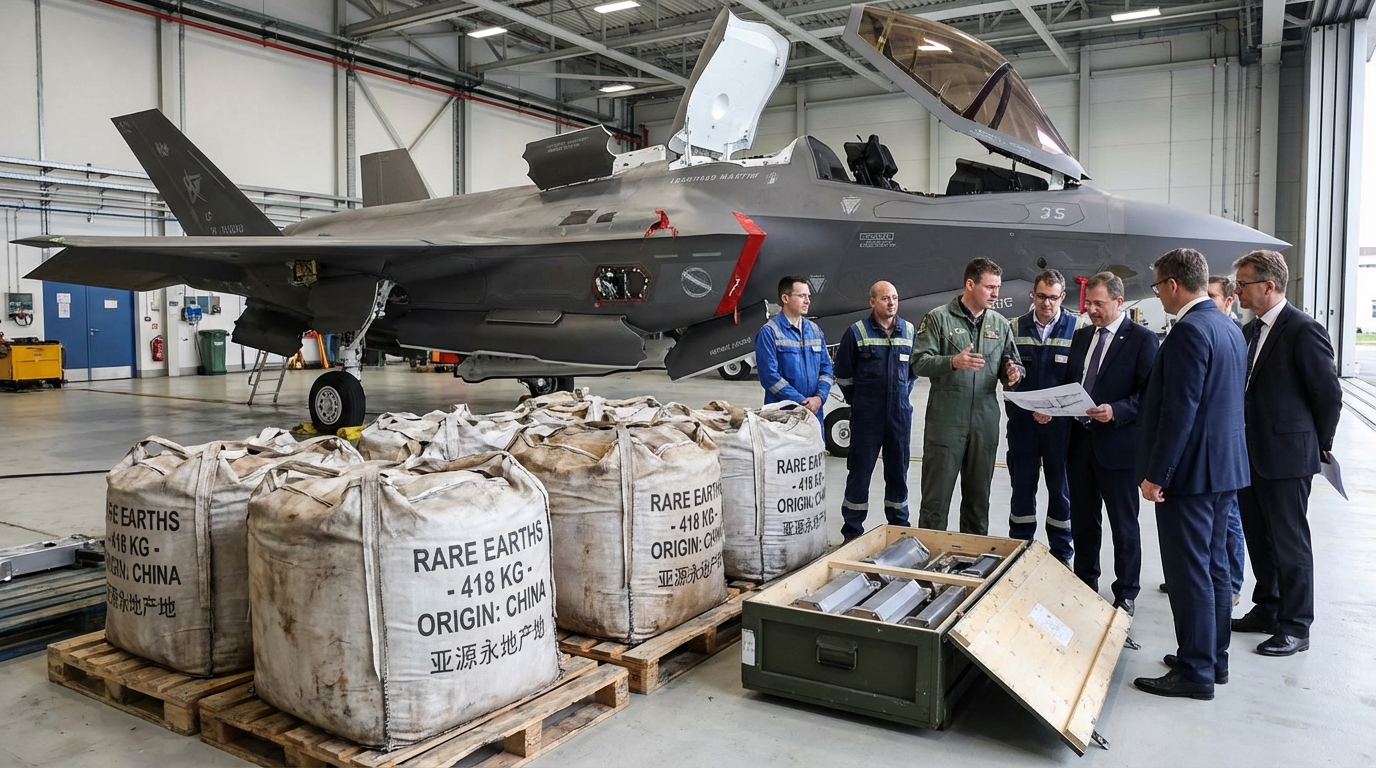
    From an operational perspective, this chain is unforgiving. A traction motor typically embeds around 1.2-3.8 kg of NdFeB magnets per EV, while an offshore direct‑drive wind turbine can use in the order of 600-800 kg of magnet material per megawatt of capacity [1]. Any disruption upstream of magnet block supply propagates rapidly into assembly plants and project schedules. The 2025 Chinese export licence regime for dysprosium (Dy), terbium (Tb) and related products, combined with still‑nascent ex‑China separation and recycling capacity, has turned what was once a pricing problem into a structural availability issue.

    The analysis below follows the NdFeB chain end‑to‑end-from ore to motor-and focuses on where the system is actually binding between 2024 and 2026. The emphasis is on industrial feasibility, process constraints and operational risk, using concrete project examples in jurisdictions prioritising “friend‑shoring” (United States, Australia, Europe, UK) and the regulatory regimes reshaping how material can move across borders.

    1. Technical Backbone: From Ore to NdFeB Motor

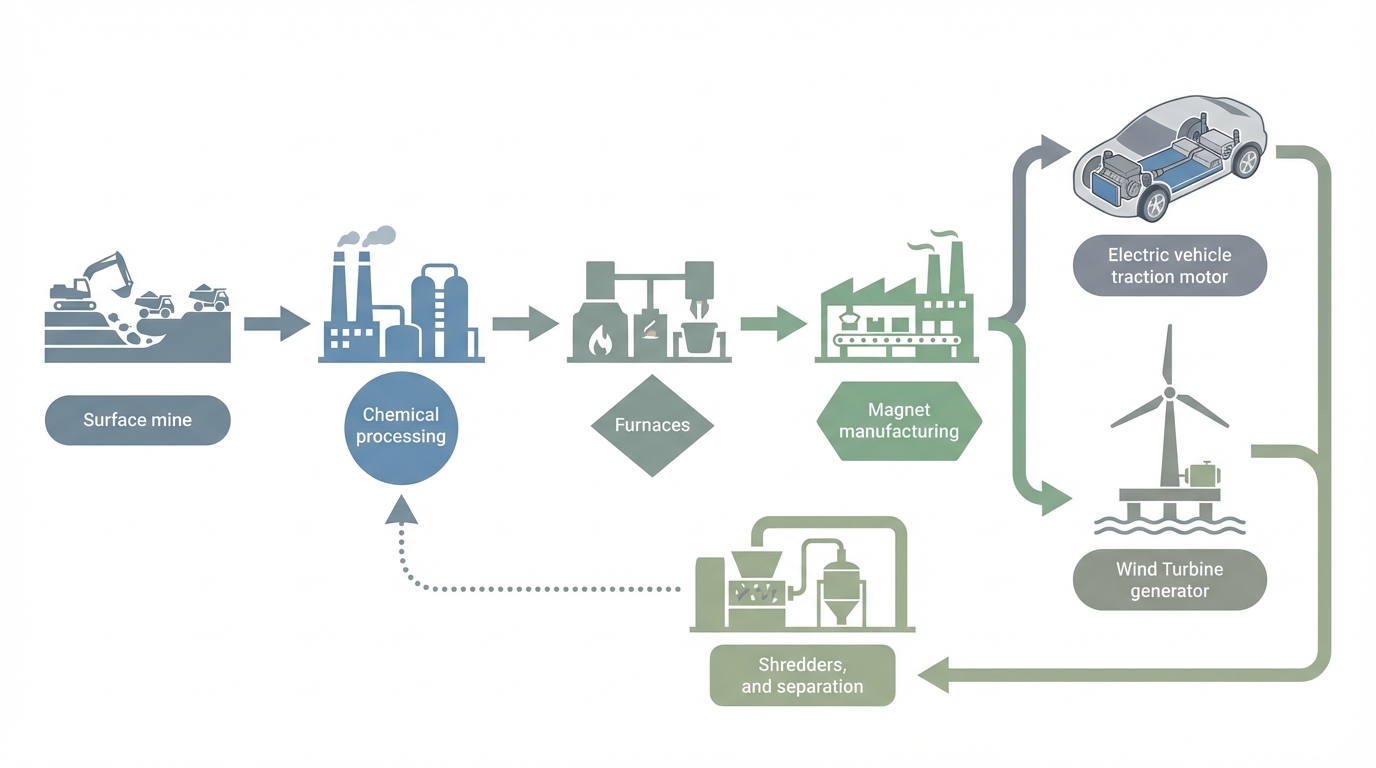
    NdFeB magnets are, chemically, a relatively simple alloy family. Industrial compositions cluster around Nd2Fe14B, modified with praseodymium (Pr) and small additions of Dy or Tb to maintain coercivity at elevated temperatures. Technically, however, every kilogram of magnet embodies a long chain of extraction and processing steps: mining and concentration of rare‑earth‑bearing minerals, chemical cracking and separation, conversion to metals and alloys (including ferroboron), powder metallurgy, sintering, machining, coating and final motor integration.

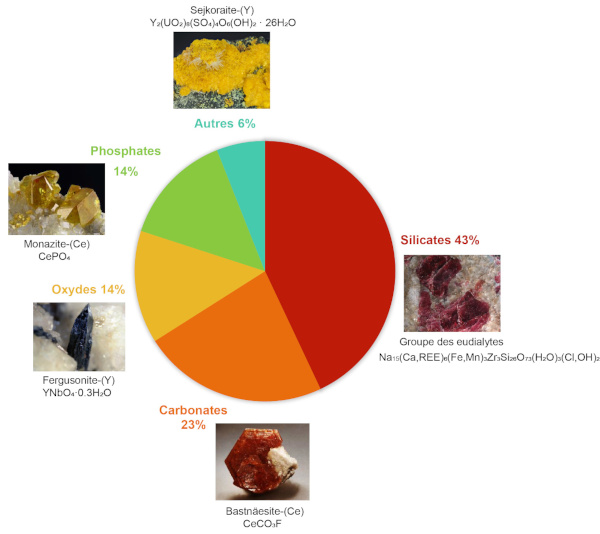
    Upstream, bastnäsite and monazite remain core feedstocks. These minerals carry light rare earth elements (LREEs) such as neodymium and praseodymium, and often minor quantities of heavy rare earth elements (HREEs) including dysprosium and terbium. Deposits such as Mt Weld (Australia), Mountain Pass (USA) and monazite streams at mineral sands operations provide the geological basis for the chain [1][5][6]. Ore is mined, milled and concentrated into a rare earth mineral concentrate before undergoing “cracking” via acid or caustic roasting and leaching.

    The critical mid‑stream step is solvent extraction (SX) separation. Here, multi‑stage mixer–settler banks partition the light and heavy rare earths through thousands of equilibrium stages. Dy and Tb have very similar chemical behaviour to adjacent rare earths, making high‑purity separation slow, energy‑ and reagent‑intensive. Industry reporting cited by S&P Global [5] and others indicates that >90% of global rare earth separation capacity-including essentially all large‑scale heavy rare earth separation—is located in China, with only two meaningful heavy‑rare‑earth‑capable plants outside China (in Malaysia and Estonia) [2][6].

    Once separated, rare earth oxides are converted to metals (e.g., Nd metal) and then alloyed. NdFeB magnet alloy production typically uses vacuum induction melting and strip casting to form thin flakes with controlled microstructure, followed by hydrogen decrepitation (HD) and jet milling to create fine, anisotropic powder. This powder is then aligned in a magnetic field, pressed, sintered, heat‑treated, machined and coated (often with multi‑layer Ni–Cu–Ni and epoxy) to manage corrosion and mechanical robustness.

    Ferroboron is a less visible but equally critical node. In industrial practice, boron is frequently introduced as a ferroalloy—ferroboron—rather than pure boron metal. Projects such as 5E Advanced Materials’ Fort Cady in California aim to produce ferroboron from boric acid feedstock, targeting around 5,000 metric tonnes (MT) per year in the longer term under a pilot starting in 2026 [3]. The United States Geological Survey has flagged that the US currently has no domestic ferroboron production and relies on imports [3], creating a distinct vulnerability even when rare earth supply is otherwise secured.

    Downstream, magnet blocks are incorporated into interior permanent magnet (IPM) traction motors, generators and a wide range of aerospace and industrial applications. For high‑temperature duty—such as rotor magnets in EVs or high‑speed aerospace actuators—Dy and Tb additions are used to maintain coercivity and prevent demagnetisation. Grain boundary diffusion processes can reduce heavy rare earth content per kilogram of magnet, but cannot yet fully eliminate Dy/Tb demand without sacrificing performance for many demanding drive cycles.

    2. Bottlenecks 2024–2026: Where the Chain Is Binding

    The NdFeB chain is often depicted as a linear flow from mine to motor. In practice, it behaves more like a set of coupled bottlenecks. For 2024–2026, four constraints dominate: heavy rare earth separation, ferroboron production, magnet manufacturing concentration, and a recycling base too small to materially offset primary supply shocks.

    Stage China Share (2026 est.) Critical Bottleneck Operational Impact by 2026
    Mining ~60–70% REO production [5] Limited heavy rare earth (Dy/Tb) outside China Structural deficit for high‑temperature NdFeB magnets [5]
    Separation & Refining >90% [2][5] Heavy rare earth separation monopoly; only two significant ex‑China heavies plants Chinese export licences reported to affect c. 15% of Japanese magnet production [2][5]
    Alloy (Ferroboron) US 100% import reliance [3] No US ferroboron production Latent risk for EV and defense alloy supply [3]
    NdFeB Magnet Manufacturing ~92% [1][5] Manufacturing and technology clustered in China Downstream bottlenecks for aerospace, EVs and electronics during restrictions [2][5]
    Recycling <1% of supply [1][2] Limited scrap processing and collection Early‑stage relief; potential ~10% contribution by 2036 [1][2]
    Motor Integration Diversified geographically Dependence on magnet block availability and qualification Documented plant slowdowns and closures (e.g., Ford facility in 2025) [2][5]

    Several themes stand out. First, Dy and Tb separation capacity is tightly concentrated. S&P Global [5] and EU sources [6] consistently frame heavy rare earth processing—rather than mining—as the principal bottleneck for high‑temperature magnet material. Even where projects such as Northern Minerals’ Browns Range can supply heavy rare earth concentrate, the actual conversion to separated Dy/Tb oxides or metals often still depends on Chinese SX capacity or small ex‑China plants operating near their technical limits.

    Second, China’s December 2025 export licence regime for Dy, Tb, yttrium (Y) and lutetium (Lu), as well as certain NdFeB‑related products, has system‑wide effects. Industry reporting [2][5] indicates that licences are now required not only for direct exports, but also for some products manufactured outside China that incorporate Chinese‑origin heavy rare earths, with a six‑month transition period. Exemptions exist for very low content (reported at less than 0.1% in the input data), but many traction and wind magnets fall well above such thresholds. Sources cited in the draft article point to heavy rare earth price premiums of roughly one‑quarter emerging post‑implementation, and cases where Japanese magnet plants reliant on Chinese feedstock have experienced material disruptions [2][5].

    Third, ferroboron has shifted from a commodity alloy to a critical node. With the US at 100% import dependence for ferroboron and USGS explicitly highlighting the absence of domestic production [3], alloy plants producing NdFeB feedstock remain exposed even if Nd/Pr supply is diversified. The 5E Advanced Materials Fort Cady project, which targets around 5,000 MT per year of ferroboron after a pilot phase commencing 2026 [3], is emblematic: progress there directly affects the feasibility of a mine‑to‑magnet chain that does not loop back to overseas ferroboron suppliers.

    Finally, magnet manufacturing remains heavily China‑centric. Estimates collated in [1] and [5] place China’s share of NdFeB magnet production around 92%, with more than 90% of processing capacity. Even when rare earth oxides or metals are sourced from Australia or the US, many magnet designs still go through Chinese grinding, sintering and finishing facilities. The Ford plant closure in Chicago in 2025, referenced in [2][5], highlights how quickly downstream automotive operations react to supply uncertainty at the magnet stage.

    3. Project‑Level Nodes: 12 Critical Installations for 2026

    Mapping the mine‑to‑motor chain against specific projects reveals where incremental tonnes actually translate into reduced system fragility. The draft input classifies 12 projects and plants into three tiers based on 2026 relevance: Tier 1 for immediate bottlenecks (especially separation and heavy rare earths), Tier 2 for alloy and magnet capacity, and Tier 3 for recycling and European autonomy. Capacities and timelines below derive from the sources cited [1][3][4][5][6][7][8].

    Diagramme de la chaîne d’approvisionnement des aimants NdFeB, de la mine au moteur électrique et à l’éolienne offshore.
    Diagramme de la chaîne d’approvisionnement des aimants NdFeB, de la mine au moteur électrique et à l’éolienne offshore.

    Tier 1 – Immediate Bottlenecks: NdPr and Heavy Rare Earth Supply

    Lynas Rare Earths – Mt Weld & Kalgoorlie (Western Australia)
    Mt Weld is one of the highest‑grade rare earth deposits globally. Lynas’ operations, combined with its Kalgoorlie processing hub, are reported in the input as having capacity around 7,000 MT per year of rare earth oxides (REO) focused on NdPr, with an expansion pathway towards approximately 10,500 MT per year by end‑2026 [1][5]. Industry commentary in [1] suggests Lynas supplies in the order of 15% of ex‑China NdPr for traction motors and offshore wind. Operationally, Mt Weld and Kalgoorlie face conventional mining and processing challenges—port congestion at Fremantle, Australian environmental scrutiny of radioactive residues—but their strategic function is clear: they form one of the few large, integrated, non‑Chinese NdPr supply nodes.

    MP Materials – Mountain Pass (California, USA)
    Mountain Pass is currently the only significant US rare earth mine. The input cites capacity of around 40,000 MT per year of REO production from bastnäsite, with a Phase 2 separation project targeting roughly 6,000 MT per year of NdPr by late 2025 [1][7]. Reported 2025 production of around 45,000 MT REO [1] and a supply arrangement with General Motors for ~1,000 MT per year of NdFeB alloy underscore Mountain Pass’s role in enabling US‑based magnet and motor production. At the same time, MP remains constrained by external Dy/Tb supply and US permitting timelines, including Environmental Protection Agency (EPA) processes highlighted in the draft as a risk factor for 2026.

    Northern Minerals – Browns Range (Western Australia)
    Browns Range, in the Tanami region, is one of the few heavy rare earth‑focused projects outside China. The draft notes a planned capacity of around 1,500 MT per year of Dy/Tb‑equivalent output, with first production targeted for the second half of 2026 [1]. A pilot separation plant around 500 MT per year is referenced (Crackshot lode: 4.2 Mt at 0.61% TREO) [1]. The strategic role is straightforward: Browns Range provides Dy/Tb feedstock for high‑temperature NdFeB used in offshore wind, aerospace and high‑load EV motors. The challenges are equally clear—CAPEX inflation reported at ~30%, and opposition from some Indigenous stakeholders, which can affect timelines and social licence.

    Iluka – Eneabba (Western Australia)
    Eneabba reprocesses monazite‑rich mineral sands to generate rare earth‑bearing feedstock. According to [6] and the draft, it processes around 10,000 tonnes per year of monazite, with a rare earth capacity framed at around 300 MT per year of monazite‑derived rare earth content in early phases, ramping through 2026. As a producer of NdPr and some heavies, Eneabba is listed by Australia as a critical mineral project [6]. Technically, the main constraints are management of thorium‑bearing residues and logistics to Fremantle via rail, both of which add regulatory and operational complexity but also create a template for other monazite‑based projects.

    Tier 2 – Alloy and Magnet Capacity: Ferroboron and Mine‑to‑Magnet Integration

    5E Advanced Materials – Fort Cady (California, USA)
    Fort Cady is primarily a boron resource, but its strategic role is centred on ferroboron. Morningstar‑linked reporting [3] and the draft describe a target of around 5,000 MT per year of ferroboron, with pilot‑scale operations envisaged by 2026. This directly addresses the USGS‑identified gap in US ferroboron production [3]. From a process standpoint, Fort Cady’s task is to convert boric acid streams into a consistent ferroboron alloy that meets tight impurity and composition tolerances for NdFeB producers, while integrating into broader mine‑to‑magnet initiatives in North America.

    USA Rare Earth – Round Top (Texas, USA) and Magnet Plant (Oklahoma)
    USA Rare Earth’s Round Top project is positioned as a full mine‑to‑magnet chain in the US. The input cites a projected 2,000 MT per year of NdFeB magnet capacity at Round Top‑linked facilities, alongside a resource base of around 1.6 billion tonnes and a Stillwater plant in Oklahoma slated for up to 4,000 MT per year of magnets [7]. The strategic ambition is to close the loop from rare earth mining through separation to finished magnets for defense and industrial applications. Heavy rare earth grades are variable, according to the draft, adding geological risk. On the processing side, establishing repeatable powder metallurgy and sintering quality at this scale, in a region without an established NdFeB labour and supply ecosystem, is a non‑trivial challenge.

    Phoenix Tailings (Massachusetts, USA)
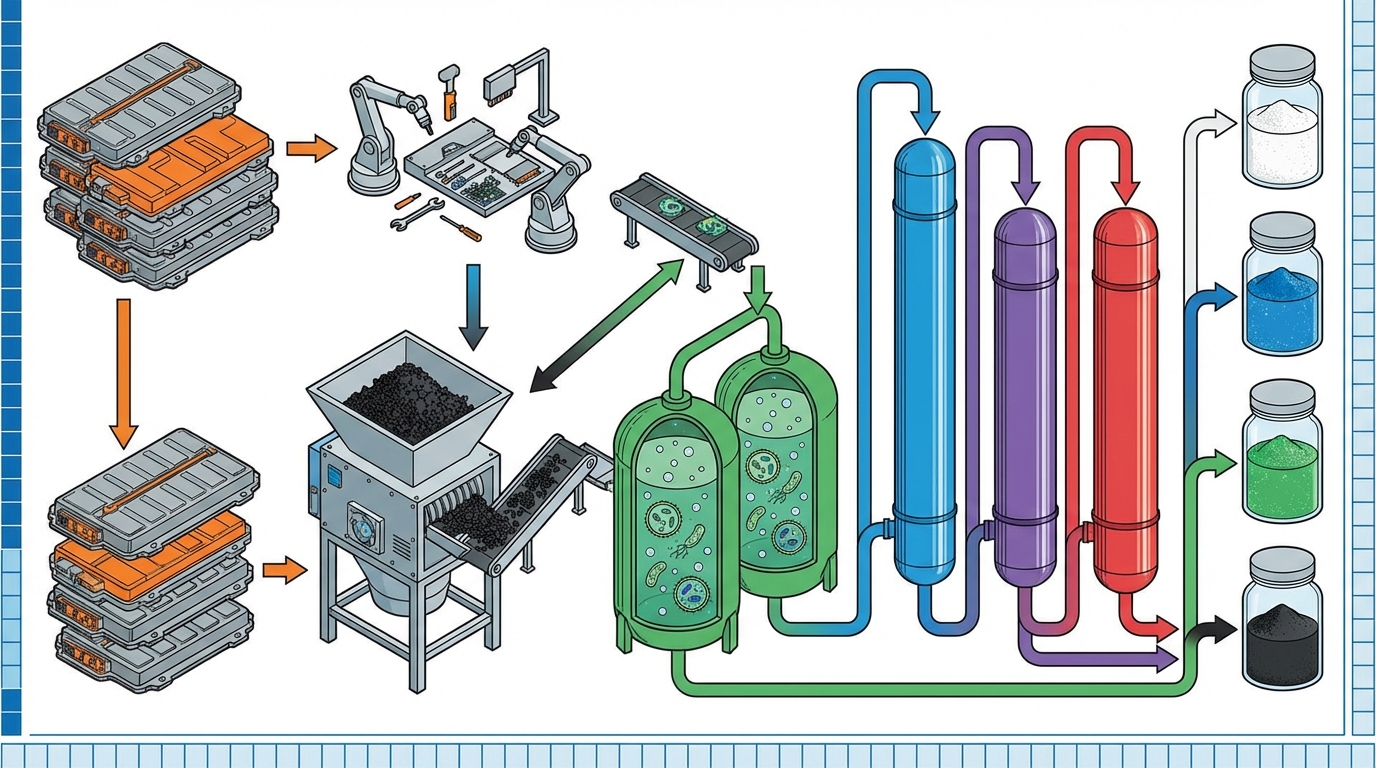
    Phoenix Tailings embodies the recycling and “zero‑waste” end of the mid‑stream innovation spectrum. The company is reported in [2][7] as operating around 200 MT per year of recycled NdFeB‑related rare earths, with a scale‑up target of ~500 MT by 2026, supported by around $10 million in US Department of Energy (DOE) funding. The technical core is a plasma‑based process that claims to process magnet scrap with minimal waste. Operationally, the limit is not only technology scale‑up, but feedstock: sufficient volumes of clean, segregated magnet scrap with known composition, along with the qualification of recycled material for defense and automotive applications.

    Tier 3 – Recycling and European Autonomy

    HyProMag – Tyseley Energy Park (Birmingham, UK)
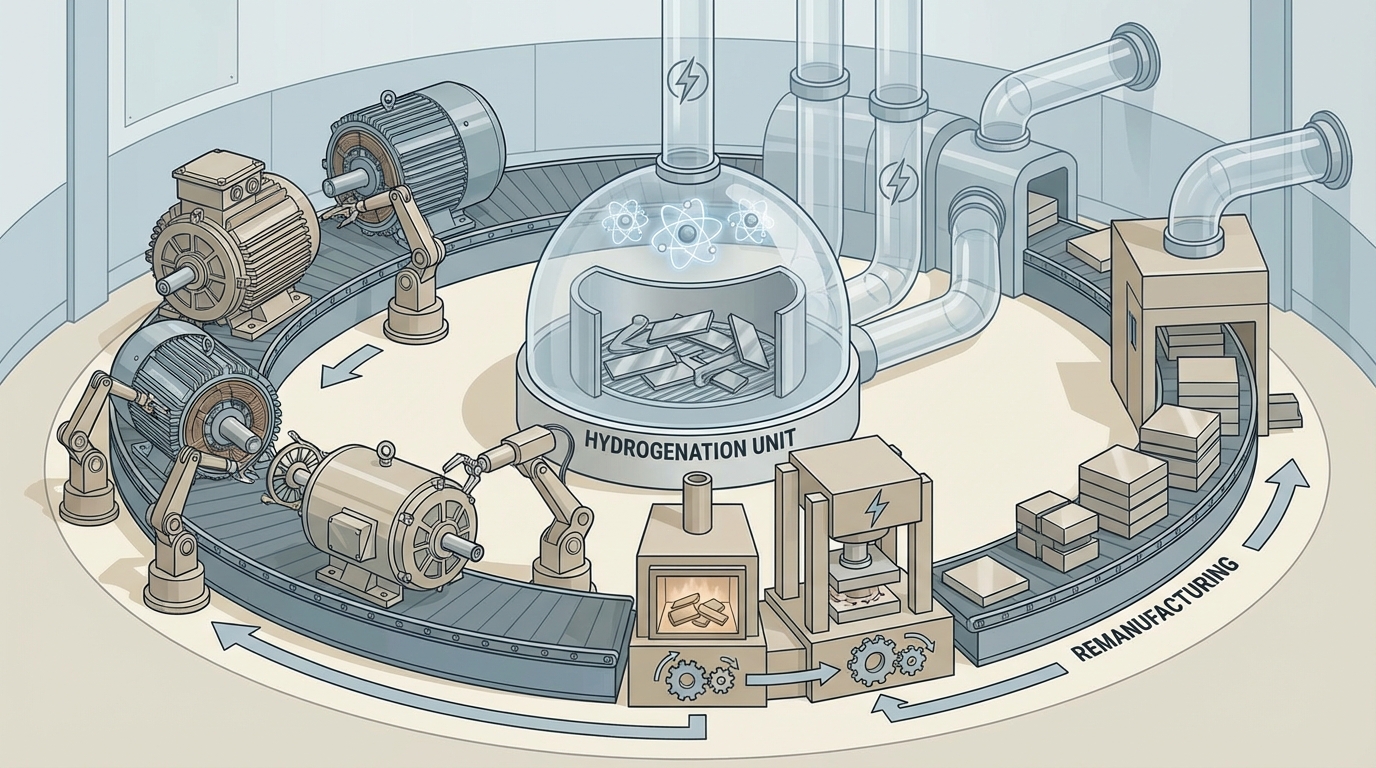
    HyProMag’s Tyseley plant is one of the first commercial demonstrations of Hydrogen Processing of Magnet Scrap (HPMS) in Europe. The project is described in [4] as targeting around 300 MT per year of NdFeB blocks from scrap by 2026, following a 50 MT pilot in 2025. HPMS uses hydrogen to embrittle and decrepitate magnets directly from scrap motors and hard disk drives, preserving the alloy chemistry and magnetic alignment where possible. The practical constraints are hydrogen handling, contamination control and EU regulatory constraints on importing magnet scrap, including from China, within the framework of the EU Critical Raw Materials (CRM) Act [4][6].

    Carester – Estonia
    Carester operates rare earth separation facilities in Estonia, one of the very few heavy rare earth separation capacities outside China. The draft cites around 500 MT per year of rare earth separation capacity focused on heavies, with expansion through 2026 [2][6]. Strategically, Carester’s operations are tied to European efforts to build at least 10% domestic extraction and 40% processing of critical raw materials by 2030 under the CRM Act [6]. The plant’s feedstock, however, is still partly linked to Chinese or Chinese‑influenced streams, and is so exposed to the same dual‑use export controls that affect magnet producers in Japan or the EU.

    Globe Metals & Mining – Kanyika/Associated Projects (Australia/Mozambique)
    Globe Metals & Mining’s portfolio includes niobium‑tantalum and rare earth‑containing projects, with the draft indicating around 1,000 MT per year of magnet‑relevant rare earth output under development and qualification for 2026 [5][8]. The co‑production of niobium and tantalum makes these projects relevant for defense and advanced electronics. The CEO is cited in [5] as emphasising refining as the principal bottleneck: without additional separation and refining capacity for heavies, new mine output cannot fully translate into magnet‑grade feedstock. Logistics from African sites and regulatory stability add further layers of execution risk.

    Vue d’ensemble d’une mine moderne de terres rares, illustrant l’extraction des éléments critiques pour les aimants NdFeB.
    Vue d’ensemble d’une mine moderne de terres rares, illustrant l’extraction des éléments critiques pour les aimants NdFeB.

    Peninsula (Pilbara, Australia)
    Peninsula’s high‑grade monazite project in the Pilbara is positioned in the draft as an advanced exploration asset targeting around 2,500 MT per year of REO, with first production indicated for 2027 but offtakes and contracts already under discussion for 2026 [1]. The main operational constraint is water management in a desert environment, which affects both mining and chemical processing. Geopolitical risk is comparatively low, but processing risk remains: as with other monazite projects, thorium and radionuclide management must meet stringent Australian regulatory standards.

    Energy Fuels – White Mesa (Utah, USA)
    White Mesa is primarily a uranium mill that has increasingly shifted into rare earth processing. The input cites a capacity of around 1,000 MT per year of NdPr by 2026, supported by approximately $134 million in DOE funding across the US rare earth chain [7]. White Mesa’s co‑production model leverages existing uranium circuits to crack and process rare earth‑bearing feeds. The flip side is regulatory intensity: Nuclear Regulatory Commission (NRC) oversight, coupled with community scrutiny of radioactive waste, creates a complex permitting and compliance environment. From a resilience perspective, however, co‑processing uranium and rare earths provides a way to amortise infrastructure and maintain operating continuity under multiple commodity price regimes.

    4. Process Risk and Operational Failure Modes

    Looking across these projects, risk clusters as much around process engineering as around geology. Separation plants face scaling and environmental challenges, alloy and magnet plants grapple with microstructure control and impurity management, and recyclers battle feedstock heterogeneity and regulation.

    Separation and refining. Solvent extraction circuits for rare earths can involve hundreds to thousands of mixer–settler stages, with tight temperature, pH and phase‑ratio control. Deviations cause cross‑contamination between adjacent rare earths, lowering product purity and increasing the need for re‑processing. Heavy rare earth circuits are particularly sensitive, as separation factors between Dy, Tb and their neighbours are small. Effluent streams often contain sulphate, nitrate and chloride species alongside radionuclides from monazite or other thorium‑bearing minerals, which require robust tailings and water treatment systems. Projects such as Eneabba and White Mesa therefore combine process control risk with regulatory scrutiny over radioactive waste streams.

    Alloy and sintered magnet production. NdFeB alloy production hinges on repeated thermal and mechanical steps that define grain size, orientation and boundary chemistry. Strip casting, hydrogen decrepitation, jet milling and sintering all influence coercivity, remanence and mechanical integrity. Failure modes include abnormal grain growth, oxygen or carbon contamination from process gases and tooling, and non‑uniform Dy/Tb distribution leading to local demagnetisation at elevated temperature. Once a plant has qualified a recipe for a specific automotive or aerospace platform, even small process changes can trigger lengthy re‑qualification cycles.

    Recycling technologies. HPMS, as deployed by HyProMag, uses hydrogen to expand and crack sintered magnets in situ. This preserves much of the anisotropy and composition, allowing direct re‑use in some cases. However, hydrogen handling introduces explosion and embrittlement risks, and scrap streams frequently carry coatings, adhesives and mechanical damage that complicate processing. Plasma‑based methods such as those developed by Phoenix Tailings offer the potential for broader feedstock tolerance but must still deal with slag chemistry, off‑gas treatment and reproducible separation of rare earths from iron and other alloying elements. Across both approaches, one structural limitation dominates 2024–2026: the quantity and quality of available scrap, particularly from end‑of‑life EVs that are only now beginning to reach dismantling volumes [2][4].

    These technical risks translate directly into industrial continuity questions. A separation plant excursion can temporarily reduce product purity below magnet‑grade specifications. An alloy furnace or sintering line deviation can produce entire batches of magnets that fail downstream qualification tests, delaying EV or wind turbine production by months. This is why project‑level capacity additions in tonnes per year tell only part of the story; the rest lies in process stability and qualification track record.

    5. Regulation, Geopolitics and Industrial Resilience (2024–2026)

    Regulatory and geopolitical developments between 2024 and 2026 are reshaping how NdFeB supply chains can be configured, sometimes more decisively than geology or technology.

    Chinese export restrictions. The 2025–onwards Chinese export controls on Dy, Tb, Y, Lu and certain magnet‑related products, effective from December 2025 with a reported six‑month transition [2][5], extend beyond simple quotas. Licensing requirements apply to a range of products, and industry reports summarised in the draft suggest that even overseas manufacturing using Chinese‑origin heavies may fall within scope. Exemptions for content under about 0.1% limit relief mainly to low‑Dy/Tb applications. The net effect observed in market commentary [2][5] has been persistent price premiums on NdPr and heavy rare earth units and a heightened focus on documenting origin and content in supply contracts.

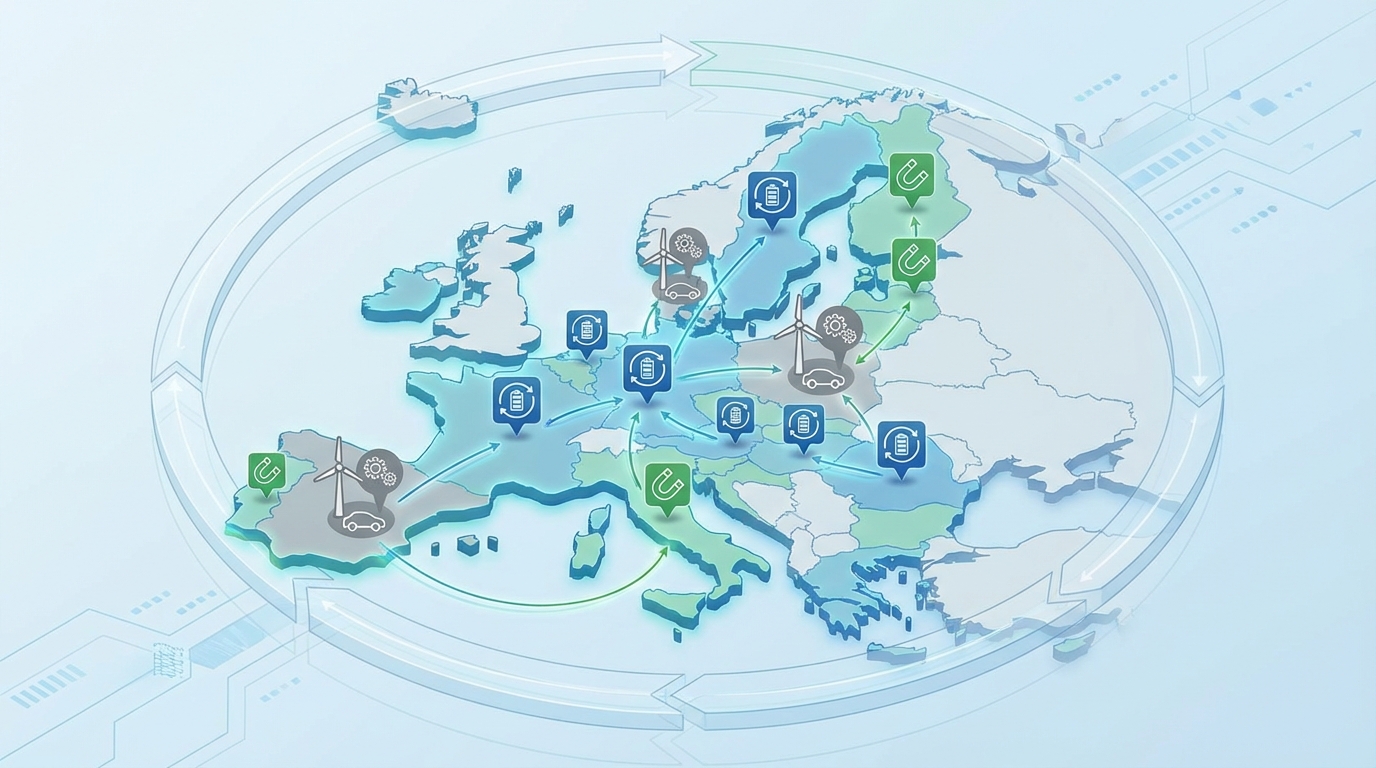
    EU Critical Raw Materials Act. The EU CRM Act, adopted in 2024, sets indicative targets of 10% domestic extraction and 40% domestic processing of critical raw materials by 2030 [6]. For NdFeB‑relevant materials, this has translated into accelerated permitting pathways and potential subsidy schemes for projects such as Eneabba‑linked supply, Carester’s Estonian plant and Tyseley’s HPMS facility. The draft notes that EU funding and regulatory support are being used to fast‑track select non‑Chinese supply projects through 2026, with the explicit objective of strategic autonomy in critical minerals [6].

    US DOE and defense‑linked funding. The US Department of Energy announced around $134 million of funding in 2025 to strengthen rare earth element supply chains [7]. The input links this funding to projects including MP Materials, 5E Advanced Materials and Energy Fuels, with awards expected in the first quarter of 2026 and an explicit focus on mine‑to‑magnet integration. DOE and Department of Defense (DoD) programmes have also provided support to Lynas and others for US‑based separation or magnet production targeted at defense platforms. US government analyses referenced in the draft indicate that these measures are expected to reduce NdFeB import dependence for defense applications by roughly one‑fifth [7]. The framing is explicitly one of industrial resilience and secure operation of critical defense and energy systems rather than commercial return.

    Australian critical minerals policy. Australia’s Critical Minerals Strategy (2024–2026) provides tax incentives and other support for projects such as Lynas, Northern Minerals and Iluka [1]. The draft notes that this has encouraged additional non‑Chinese processing capacity, while also contributing to CAPEX cost inflation estimated around 15% on some projects [1] as the supply chain for specialised equipment, reagents and skilled labour tightens. For NdFeB, the Australian cluster plays a central role in supplying both light and heavy rare earth feedstock into global chains that are attempting to diversify away from Chinese bottlenecks.

    Schéma technique d’un moteur de traction de véhicule électrique mettant en évidence les aimants permanents NdFeB.
    Schéma technique d’un moteur de traction de véhicule électrique mettant en évidence les aimants permanents NdFeB.

    Compliance and origin verification. Compliance teams across OEMs and magnet producers have shifted focus towards “Chinese rare earth content” verification. The draft notes that assays and documentation are being used to trace material origin, while more complex practices such as blending EU‑sourced scrap with Chinese primary material can complicate origin declarations [5]. A key operational failure mode here is misalignment between export control assumptions and actual material content, leading to shipment delays or retroactive regulatory scrutiny. The other is non‑qualification of alternative magnet suppliers, where the 6–12 month qualification timelines cited in the input [5] clash with rapid regulatory or geopolitical shocks.

    6. Sectoral Implications and Trade‑Off Structures

    The same set of bottlenecks expresses itself differently in EVs, wind, defense and broader industrial applications. What changes is the tolerance for cost, the flexibility of design, and the acceptable level of geopolitical exposure.

    Electric vehicles. EV traction motors typically contain around 1.2–3.8 kg of NdFeB magnets per vehicle, according to the draft and [1]. IPM motors, widely used in mainstream EV platforms, rely on high‑coercivity NdFeB, often with Dy additions to maintain performance at rotor temperatures. When Dy/Tb prices spike or availability tightens, motor design teams evaluate alternatives: wound‑rotor synchronous motors, induction motors or ferrite‑based permanent magnet designs. These alternatives can reduce Dy/Tb intensity but often entail higher copper usage, increased mass, or reduced efficiency under specific drive cycles. The result is a design trade‑off between heavy rare earth exposure, efficiency targets and power density.

    Fleet‑level planning models referenced in [1][4] show scenarios where a portion of EV production is supplied from ex‑China NdPr (for example via Lynas and MP Materials) combined with early‑stage recycling from HyProMag and Phoenix Tailings. In these scenarios, a meaningful share of magnet tonnes in 2026–2027 would still trace back to China, but exposure is reduced relative to an all‑Chinese mid‑stream. Qualification timelines for new magnet suppliers, typically 6–12 months as cited in [5], remain a rate‑limiting step.

    Wind. Direct‑drive offshore wind turbines use around 600–800 kg of magnet material per megawatt of capacity [1]. The sheer intensity of magnet usage means that wind OEMs are extremely sensitive to Dy/Tb availability. While some designs rely on lower Dy content with careful cooling and operating envelopes, a significant portion of installed and planned fleets still expect high‑temperature NdFeB with heavy rare earth additions. Australian Tier 1 projects such as Browns Range and Mt Weld, along with separation plants like Carester and Eneabba, feature prominently in industry discussions [1][5][6] about how to anchor long‑term supply for offshore wind. The trade‑off here is between locking into long‑term, relatively concentrated supply arrangements and maintaining optionality as new projects and recycling capacity come online.

    Defense and aerospace. Defense applications consume a smaller absolute tonnage of NdFeB but operate with significantly tighter specifications and much lower tolerance for supply interruption. Missile guidance systems, actuators, radar drives and other components often require bespoke magnet grades and long‑lived qualification. The draft notes qualification cycles of around 18 months for some defense and aerospace magnets [3][7]. For this segment, vertical integration efforts such as USA Rare Earth’s mine‑to‑magnet chain, MP Materials’ alloy supply agreement with GM (which also touches defense‑relevant platforms), and Energy Fuels’ co‑production model at White Mesa are primarily framed as resilience and continuity measures.

    Industrial and electronics. Broader industrial and electronics uses—motors, sensors, HDDs—often have more flexibility in magnet composition and supplier choice, but face their own constraints. Many depend on commodity‑grade NdFeB magnets produced in large volumes by Chinese manufacturers. Shifting to ex‑China suppliers typically involves price premiums and logistics adjustments. In this segment, magnet recycling from HDD scrap using HPMS, like HyProMag’s process, can play a larger role earlier, as qualification thresholds for consumer and industrial electronics can be less stringent than for EV or defense platforms.

    Across sectors, a few trade‑off structures recur: concentration versus resilience (large Chinese clusters versus dispersed smaller ex‑China plants), performance versus heavy rare earth intensity (high‑Dy NdFeB versus alternative motor topologies), and primary mining versus recycling (capital‑intensive new mines versus slower‑building scrap flows). After several years of mapping and scenario work, a consistent pattern emerges: new mining and separation projects can add tonnes, but without parallel progress in ferroboron, magnet manufacturing and recycling, the effective ceiling on usable NdFeB in 2026–2028 remains lower than simple capacity sums would suggest.

    7. Synthesis: Conditions for Success and Failure in the NdFeB Chain

    By 2026, the NdFeB magnet supply chain is defined as much by mid‑stream chemistry and regulatory regimes as by mine output. Heavy rare earth separation remains the tightest bottleneck, with projects like Browns Range and Carester providing incremental relief but not yet altering the fundamental concentration of Dy/Tb processing in China. Ferroboron stands out as a quietly critical variable: without domestic US ferroboron production, even a fully domestic NdPr supply risks bottlenecking at the alloy stage.

    On the upside, several elements of the system are shifting in favour of greater resilience. Australian and US projects such as Lynas, MP Materials, Iluka Eneabba, Energy Fuels and USA Rare Earth are progressing along the path from resource to separated oxides and, in some cases, to magnets. HPMS and plasma‑based recycling demonstrated by HyProMag and Phoenix Tailings are building the foundation for a scrap‑fed buffer that industry analyses [1][2][4] see contributing around 10% of NdFeB‑relevant material by the mid‑2030s. EU and US policy frameworks (CRM Act, DOE and DoD programmes) are explicitly structuring incentives around continuity of critical operations rather than short‑term price signals.

    The downside risks are equally concrete. Export control tightening on Dy/Tb and related products, delays in environmental or nuclear‑related permitting for key separation plants, and non‑qualification of new magnet producers within required timeframes have all been observed in recent years and remain live failure modes. Logistics constraints—such as congestion at Fremantle for Australian exports or rail bottlenecks in North America—can act as unexpected choke points for what is otherwise technically available capacity.

    After several years of closely tracking these projects, one insight stands out: NdFeB is no longer just a materials story; it is a systems‑engineering problem spanning chemistry, policy, logistics and long‑cycle qualification. The systems that manage to maintain stable magnet supply into EV, wind and defense platforms over 2024–2028 will be those that treat heavy rare earth separation, ferroboron availability, magnet process stability and regulatory compliance as a single, coupled risk surface rather than as isolated problems. TI22 Strategies’ work continues to focus on active monitoring of weak signals—policy drafts, project execution data, qualification milestones and technology shifts—that can materially change that risk surface for NdFeB supply chains.

    Note on the TI22 methodology TI22’s assessments combine continuous monitoring of official texts and regulatory signals (including export control bulletins and critical raw material strategies), structured market and project data from sources such as S&P Global and DOE publications, and detailed analysis of technical specifications and end‑use requirements in EV, wind and defense applications. This cross‑view makes it possible to link seemingly minor changes—such as a permit delay at a separation plant or a new HPMS pilot—to concrete implications for magnet availability and industrial continuity.

    Sources

    • [1] Future Markets Inc., “The Global Energy Transition Market 2026–2036: Critical Materials, Technologies & Supply Chains” – Link
    • [2] Okon Recycling, “Magnet Recycling and Applications – Sustainability and Magnets” – Link
    • [3] Morningstar / Accesswire coverage of 5E Advanced Materials and USGS commentary on ferroboron – Link
    • [4] Benchmark Minerals, “Making Sense of the Energy Transition’s Most Complex Supply Chains” – Link
    • [5] S&P Global Commodity Insights, “Rare earth supply bottlenecks set to persist in 2026” – Link
    • [6] European Court of Auditors / EU documents on the Critical Raw Materials Act – Link
    • [7] US Department of Energy, “Energy Department Announces $134 Million Funding to Strengthen Rare Earth Element Supply” – Link
    • [8] Globe Metals & Mining and related disclosures – Link
    • Lynas Rare Earths – Mount Weld project overview – Link
    • MP Materials – Mountain Pass mine overview – Link
    • Northern Minerals – Browns Range project – Link
    • Iluka Resources – Eneabba operations – Link
  • The f-35 problem: 418kg of chinese rare earths per fighter jet: Latest Developments and Analysis

    The f-35 problem: 418kg of chinese rare earths per fighter jet: Latest Developments and Analysis

    Introduction: Why the F‑35 Rare Earth Chain Matters

    The F‑35 issue is not abstract for anyone who has spent time inside defense supply chains. A few years ago, a temporary halt in F‑35 deliveries over a single magnet containing Chinese-origin alloy exposed just how brittle a multi-billion-dollar aerospace program can be when a small, specialized component goes off-spec. Around the same period, Beijing began tightening controls on critical minerals and magnet technologies, and rare earth prices and lead times became a regular item in risk committee packs. That combination of regulatory leverage and component concentration fundamentally changed the way this topic is viewed inside procurement and industrial-base teams.

    Against that backdrop, the F‑35 stands out as a stress test for Western defense resilience. Open-source analyses indicate that each aircraft embeds roughly 418kg of rare earth elements (around 900 pounds), including samarium in high-performance samarium‑cobalt (SmCo) magnets spread across avionics, actuators, radar and electronic warfare systems. Those magnets must survive extreme temperatures-up to several hundred degrees Celsius-and radiation environments where more common neodymium-iron-boron solutions struggle. That makes the F‑35 unusually exposed to any disruption in SmCo alloy and magnet supply.

    China currently refines the overwhelming majority of the world’s rare earths and produces most high-performance permanent magnets. When Beijing moved in 2025 to impose a licensing regime on rare earth products and magnets with any foreign military affiliation, with rules taking effect on 1 December 2025, it effectively acquired a veto over SmCo exports feeding programs such as the F‑35. The Pentagon’s response, including a reported $2 billion Defense Production Act (DPA) package and new provenance requirements in the FY2026 National Defense Authorization Act (NDAA), is reshaping how primes and sub‑tier suppliers think about sourcing, compliance and design choices.

    From an operational standpoint, the stakes are straightforward: avoid a repeat of earlier supply incidents, but at program scale and under deliberate external pressure. The following briefing separates the regulatory and technical facts from scenario-based interpretations, focusing on implications for production continuity, supplier portfolios and compliance governance.

    • Change in environment: As of December 2025, China applies strict export licensing to rare earth products and magnets linked to foreign militaries, while the United States has activated substantial DPA funding and NDAA sourcing rules for defense-critical minerals.
    • Périmètre: The F‑35 program is heavily exposed through roughly 418kg of rare earths per aircraft and extensive use of SmCo magnets, a domain where China has historically controlled 85-95 percent of key processing and magnet-making capacity.
    • Operational implications: Internal and external analyses suggest that, under adverse licensing conditions, F‑35 output could undershoot plans by around 20-30 percent in the mid‑2020s unless non‑Chinese capacity, recycling and stockpiles ramp faster than currently scheduled.
    • Compliance shift: The FY2026 NDAA pushes toward 100 percent traceability of rare earth provenance in F‑35 lots, transforming magnet chains from “black box” components into audited, reportable line items.
    • Limits of current response: Even with roughly $2 billion in DPA support and a 2026 allied stockpile initiative, most non‑Chinese SmCo and separation projects only begin to reach meaningful scale around 2027-2028, leaving a two- to three-year window of elevated risk.

    FACTS: Material Dependence, Regulatory Mechanics and Current Measures

    F‑35 rare earth content and SmCo magnet roles

    Multiple open-source defense analyses, including work by the Modern War Institute at West Point, estimate that each F‑35 incorporates approximately 418kg of rare earth elements. These materials appear in:

    • Samarium‑cobalt (SmCo) magnets inside flight control actuators, electric pumps, radar systems, electronic warfare suites and various sensors.
    • Neodymium‑based magnets in motors and generators where temperatures are less extreme.
    • Other rare earths such as dysprosium, terbium and gadolinium in specialized alloys, guidance systems and thermal management components.

    Pentagon assessments cited in open-source commentary indicate that a single F‑35 embeds SmCo magnets in several hundred actuators and sensors. The key technical constraint is thermal performance: SmCo retains magnetic properties and coercivity at temperatures that would demagnetize many neodymium‑iron‑boron magnets. Alternative chemistries such as samarium‑iron‑nitride or advanced ferrites exist, but at present they either underperform at the relevant temperatures or lack the qualification history for mission-critical aerospace use.

    An earlier episode illustrated how sensitive the program is to magnet provenance. In 2022, F‑35 deliveries were temporarily paused after discovery that an alloy in a magnet within the engine drive system traced back to a Chinese sub‑supplier, raising questions about compliance with statutory sourcing restrictions. The interruption was resolved, but it set a precedent: small, high‑specification magnetic components can halt an entire final-assembly line if origin or material composition fall outside allowed boundaries.

    China’s position in rare earths and magnets

    According to analyses by CSIS and others, China refines over 85 percent of the world’s rare earth oxides and produces close to 90 percent of high-performance rare earth permanent magnets, including SmCo and neodymium-based types. The concentration is especially pronounced in midstream steps:

    • Separation of mixed rare earth concentrates into individual oxides.
    • Metal and alloy production, particularly SmCo alloys with tightly controlled compositions.
    • Magnet manufacturing (sintered and bonded), where process know‑how and equipment are highly specialized.

    This dominance has been leveraged before. In 2010, export restrictions and de facto embargoes on rare earths to Japan triggered global price spikes and accelerated diversification efforts. More recently, China has introduced licensing for exports of gallium, germanium and certain rare earth magnet manufacturing technologies, explicitly citing national security and foreign policy considerations. The 2025 steps on SmCo products thus extend an existing pattern of using regulatory tools to shape access to strategic materials.

    China’s December 1, 2025 export licensing regime

    According to the sources provided, China’s Ministry of Commerce (MOFCOM) and related agencies implemented new controls that came into force on 1 December 2025. Key factual elements reported include:

    • Scope: SmCo alloys, certain rare earth oxides and high-performance rare earth magnets are subject to export licensing if there is any link to foreign militaries or military end use.
    • Presumption of denial: Licenses for exports with “any affiliation to foreign militaries” are reportedly auto‑denied, which in practice covers direct sales to U.S. defense primes and many sub‑tier suppliers.
    • End-use scrutiny: Applications require detailed end-user declarations, technical specifications and intended application disclosures, giving Chinese authorities fine-grained visibility into downstream military supply chains.
    • Transshipment coverage: The regime extends to re-exports via intermediaries such as Hong Kong, with enforcement targeting routing patterns historically used to mask final destinations.

    The “SmCo alloy incident” referred to in the input material describes a crystallizing moment in mid‑2025 when license denials for SmCo products associated with U.S. defense programs made clear that these new rules were being applied in a highly restrictive way. This coincided with reports of rising domestic Chinese demand for rare earth-based steels and alloys in infrastructure projects, further tightening export availability.

    Pentagon’s 2025 Defense Production Act package

    On the U.S. side, the Department of Defense (DoD) has progressively turned to Defense Production Act (DPA) authorities to address critical mineral vulnerabilities. Public records prior to 2025 already show DPA Title III support for projects involving MP Materials (Mountain Pass, California), Lynas Rare Earths (including its U.S. processing plans), and multiple magnet and separation initiatives.

    Building on that foundation, the input material describes a 2025 DPA package of around $2 billion targeted specifically at rare earths and magnets, including:

    • Funding for domestic SmCo magnet qualification at an established U.S. magnet producer, aiming to certify magnets for F‑35 use around 2027.
    • Substantial capital for heavy rare earth separation capacity at Lynas’s Kalgoorlie facility in Western Australia, with a focus on samarium and gadolinium streams relevant for defense alloys and magnets.
    • Pilot support to U.S.-based projects working on separation and co‑recovery of samarium and other magnet-critical elements.

    The exact amounts and schedules cited in the input (for example, hundreds of millions of dollars for individual projects and specific annual tonnage capacities) reflect program-level disclosures and industry reporting. What matters operationally is that the Pentagon is moving beyond studies toward direct co‑funding of non‑Chinese mining, separation and magnet production linked to defense requirements.

    Allied coordination and provenance rules

    Several allied policy initiatives frame the broader environment described in the input:

    • A 2026 Critical Minerals Ministerial reportedly gathered 15 allied countries and agreed in principle to coordinate stockpiling of SmCo alloys and to pursue joint procurement from jurisdictions such as Australia and Vietnam.
    • The FY2026 NDAA is described as mandating 100 percent auditability of rare earth provenance for F‑35 production lots from early 2026 onwards, with contractual penalties tied to non‑compliance.
    • Export control and mining ministries in countries including Australia, Canada and the United States have launched or expanded regimes governing critical mineral exports, environmental permitting and indigenous consultation, all of which shape how quickly non‑Chinese projects can advance.

    Alongside policy, a portfolio of non‑Chinese rare earth and magnet projects is emerging. The input highlights assets in the United States (e.g., Mountain Pass and Round Top in Texas), Australia (Mt Weld and associated processing in Kalgoorlie; Browns Range; Dubbo), Canada (Nechalacho, Wicheeda), Africa (projects in Tanzania and South Africa), Brazil, Greenland and India. Timelines and capacities vary widely, but a common feature is that most of these projects are either in ramp‑up or pre‑production phases during the mid‑2020s, rather than already operating at full, defense‑qualified scale.

    INTERPRETATION: Supply Chain Risk, Timelines and Trade-Offs

    Single-point-of-failure risk for F‑35 production

    From a supply chain risk perspective, the combination of facts above is uncomfortable. A platform that consumes hundreds of kilograms of rare earths per unit, with mission-critical reliance on SmCo magnets, is now tied to a material stream where one country both dominates processing and has chosen to deploy export controls explicitly keyed to foreign military affiliation.

    Internal and external modelling exercises cited in the input suggest that under a strict application of the 2025 Chinese licensing regime, and absent accelerated diversification, F‑35 deliveries could undershoot planned numbers by roughly 20–30 percent by mid‑2026. These figures are scenario outputs, not certainties, but they illustrate the order of magnitude at stake. In some projections, Lockheed Martin’s Fort Worth assembly lines risk idling for 12–18 weeks per 50‑jet batch if SmCo magnets or alloys are delayed.

    Experience from previous audits across electromechanical and avionics suppliers suggests that these kinds of dependencies are often more concentrated than bill-of-materials spreadsheets imply. A single approved SmCo magnet design may be produced by one or two facilities globally, even if there appear to be multiple catalog suppliers. Where extensive re‑qualification is required, lead times measured in years rather than months are common. That dynamic amplifies the impact of a licensing shock at the alloy or magnet level.

    Timeline tension: 2025 controls vs 2027+ allied capacity

    Another clear theme is timing. Chinese controls on SmCo products linked to foreign militaries came into effect on 1 December 2025. Many of the non‑Chinese projects highlighted-new separation plants, magnet lines, and heavy rare earth developments—target initial or partial production between 2026 and 2028. Pentagon-supported magnet qualification for F‑35 applications is described as aiming for mid‑2027 certification.

    During that 2025–2027 window, global non‑Chinese SmCo separation and alloy capacity remains limited. The input material references estimates that non‑Chinese capacity accounts for less than 10 percent of global SmCo separation post‑controls, with an annual shortfall on the order of 2,000 metric tonnes. If those approximate figures hold, the system faces a structural deficit in precisely the material class that underpins F‑35 magnets and other high-temperature defense applications.

    Some scenarios compiled in the input suggest that, if all the listed allied projects ramp successfully, 40–50 percent of U.S. SmCo needs could be covered by non‑Chinese sources by around 2028. That would materially reduce single-country dependence, but it does not resolve the interim gap. In practical terms, the “risk peak” appears in the mid‑2020s, not at the end of the decade.

    Operational trade-offs: speed, compliance and design choices

    For program offices, primes and major sub‑suppliers, these dynamics translate into hard trade-offs.

    • Speed vs. qualification rigor. Shifting from Chinese to non‑Chinese SmCo suppliers involves not just a new purchase order but full qualification, reliability testing and often minor redesigns. Compressing those processes to fit the 2025–2027 window risks either slower ramp‑up or increased technical and quality risk.
    • Compliance vs. flexibility. The FY2026 NDAA push for 100 percent provenance auditability means magnet supply chains are no longer opaque. Workarounds such as blending small amounts of Chinese-origin material into otherwise allied supply could collide with statutory requirements and contractual penalties.
    • Stockpiles vs. just‑in‑time. The 2026 Critical Minerals Ministerial’s aspiration for six‑month SmCo buffers reflects a recognition that just‑in‑time delivery is poorly matched to export-controlled materials. Building and rotating such stockpiles, however, ties up working capital and complicates inventory accounting, especially when handling classified or ITAR-controlled components.
    • Design conservatism vs. substitution. Moving away from SmCo toward alternative magnet materials (such as samarium‑iron‑nitride or advanced ferrites) could reduce exposure to specific Chinese-controlled steps, but only if performance requirements, thermal margins and lifetime reliability are all re‑validated—a non‑trivial engineering effort.

    From firsthand experience with supplier audits, design engineers are often reluctant to reopen qualified configurations unless absolutely necessary, especially on safety- and mission-critical systems. At the same time, compliance teams are increasingly unwilling to sign off on parts with uncertain provenance in the current regulatory climate. The F‑35 SmCo chain is caught exactly at that intersection.

    Non‑Chinese SmCo options: portfolio and constraints

    The dozen projects listed in the input—spanning the United States, Australia, Canada, Africa, Brazil, Greenland and India—illustrate both the opportunity and the constraint set.

    • North American projects such as Mountain Pass (MP Materials), Round Top (USA Rare Earth), Nechalacho (Vital Metals) and Wicheeda (Defense Metals) offer geopolitical alignment and shorter logistics chains to U.S. primes. Several already produce or plan to produce mixed concentrates, with progression toward separated oxides and eventually magnet alloys. Environmental permitting, indigenous rights processes and technical ramp‑up all affect timing.
    • Australian assets like Mt Weld and the Kalgoorlie separation plant (Lynas), Browns Range (Northern Minerals) and Dubbo (Australian Strategic Materials) combine relatively low geopolitical risk with established mining jurisdictions. However, competition from other customers (including Japanese and European magnet makers) and domestic labor and infrastructure constraints limit how much feedstock can be redirected to U.S. defense applications in the short term.
    • African, Brazilian and Greenlandic projects expand the long-term option set, often leveraging by‑product recovery from existing mining or processing operations. Here the main constraints are infrastructure, financing conditions, political stability and, in some cases, overlapping sensitivities around uranium or other co‑products.

    According to the scenario analysis in the input, even if these projects perform broadly as planned, they collectively fall short of fully replacing Chinese SmCo supply for U.S. defense demand before the late 2020s. That conclusion is consistent with prior observations from mining and processing projects: moving from resource to qualified component often takes a decade or more, especially when environmental, social and governance standards are stringent.

    Governance, tracing and evasion patterns

    The shift to tighter provenance rules in the FY2026 NDAA is already influencing governance and information systems. The input mentions pilots using blockchain-based traceability tools for magnet supply, as well as audits that have uncovered attempts to route Chinese-origin rare earth products through intermediaries such as Hong Kong or Vietnam to mask origin. Whether or not such pilots scale, the direction of travel is clear: magnet and alloy supply is moving from a relatively low-visibility commodity input to a high-visibility compliance focus.

    In practice, that means purchasing, legal and engineering functions are increasingly interlocked. Design changes that enable multi‑sourcing or substitution can materially alter compliance risk; procurement choices that chase short lead times from opaque suppliers can unwind years of qualification work if origin is later questioned. From a governance point of view, SmCo and other rare earth-dependent components are now in the same category as semiconductors: sensitive, audited and politically exposed.

    Budgetary and industrial-base implications

    The input references expectations that shifting away from Chinese SmCo and allied export controls could drive mid‑teens percentage increases in component or system-level costs for some defense platforms. These estimates are inherently uncertain and depend heavily on contracting structures, stockpile strategies and the degree of redesign or requalification required.

    What is clearer is the scale of industrial-base commitment implied. Scenario analyses cited suggest that meaningfully de‑risking SmCo supply for F‑35 and other platforms would involve DPA and related funding on the order of multiple billions of dollars, potentially including expansions beyond the reported $2 billion 2025 package. Some commentators argue that, without such scaling, risks of multi‑year delivery delays and budget overruns in the tens of billions of dollars could persist. These are not investment theses; they are reflections of the capital intensity and timeframes involved in reproducing a midstream industrial ecosystem that took China decades to build.

    WHAT TO WATCH: Key Indicators and Weak Signals

    Several concrete indicators can help track whether the F‑35 SmCo risk profile is improving or deteriorating. None of them, taken alone, is decisive; together, they form a practical dashboard for monitoring the evolving balance between Chinese control and allied resilience.

    • Chinese regulatory moves. Any expansion, relaxation or clarification of MOFCOM’s December 2025 licensing regime for rare earth products and high-performance magnets—especially with respect to “foreign military affiliation” definitions and transshipment treatment.
    • License approval data and anecdotal lead times. Patterns in how quickly export licenses are processed, which categories are systematically denied, and how Chinese suppliers communicate changed conditions to overseas customers.
    • DPA and NDAA follow-through. Appropriation levels, project selection and milestone performance for the 2025 DPA rare earth and magnet package, and any additional measures introduced in subsequent NDAA cycles targeting magnet and alloy sourcing.
    • Project milestones at key non‑Chinese assets. Commissioning and ramp‑up at facilities such as Mountain Pass, Kalgoorlie, Browns Range, Nechalacho and Round Top, especially where outputs are contractually linked to defense applications.
    • Evidence of magnet design diversification. Public or semi‑public indications that primes and Tier‑1 suppliers are qualifying multiple non‑Chinese SmCo sources or exploring alternative magnet chemistries for F‑35 subsystems.
    • Enforcement and audit outcomes. Reports of non‑compliance findings related to rare earth provenance in defense contracts, including any penalties triggered under the FY2026 NDAA regime.
    • Allied coordination mechanisms. Concrete outputs from forums such as the Critical Minerals Ministerial or the Minerals Security Partnership: joint procurement announcements, shared stockpiling arrangements, or aligned export policies.
    • Program schedule adjustments. Any revisions to F‑35 delivery schedules explicitly attributed to materials or magnet supply issues, as opposed to software, engine or airframe factors.

    Across previous critical-materials episodes—the 2010 rare earth shock, the more recent gallium and germanium controls—early signals often appeared first in export paperwork, ship-track data, and supplier lead-time notices rather than in formal policy statements. The same pattern is likely around SmCo and F‑35-relevant magnet supply.

    Note on the methodology TI22 This briefing combines close monitoring of official texts and announcements from bodies such as MOFCOM, the U.S. Department of Defense, and allied trade and mining ministries with open-source market reporting on rare earth and magnet projects, alongside analysis of the technical specifications for defense-grade magnets and actuators in platforms like the F‑35. No proprietary volume, price or contract data are used, and all forward-looking elements are explicitly framed as scenarios or interpretations rather than predictions.

    Conclusion

    The F‑35’s dependence on Chinese-linked SmCo alloys and magnets is no longer a theoretical vulnerability; it is being stress‑tested by an explicit export licensing regime that treats foreign military end use as a red line. The Pentagon’s DPA interventions, allied coordination around stockpiles, and tightening provenance requirements in the FY2026 NDAA collectively mark a decisive shift from acknowledging the problem to attempting to re‑engineer the industrial base.

    At the same time, the physics of magnet performance, the timelines of mining and separation projects, and the inertia of aerospace qualification cycles create a near-term window in which risk remains elevated. Whether the system converges toward resilience or endures periodic production shocks will depend less on single flagship projects and more on the cumulative effect of many incremental decisions across design, sourcing, permitting and enforcement. In that sense, active monitoring of weak regulatory and industrial signals around rare earths and magnets will continue to be central to understanding the trajectory of the F‑35 program and related defense supply chains.

    Sources

  • Recycling critical materials: the 15% target that could change everything: Latest Developments and Analysis

    Recycling critical materials: the 15% target that could change everything: Latest Developments and Analysis

    Concern around the 15% recycling benchmark in the EU Critical Raw Materials Act (CRMA) does not come from abstract sustainability debates. It comes from very concrete moments: magnet and battery suppliers suddenly unable to ship after export control announcements, board‑level calls triggered by rare earth price spikes, and compliance teams scrambling to interpret new traceability rules that land mid‑contract. In past sourcing cycles, assumptions that “recycling will catch up later” repeatedly collided with slow permitting, limited collection rates, and technology that was brilliant in pilot form but stubbornly hard to industrialise.

    Against that backdrop, the CRMA’s requirement that at least 15% of EU annual consumption of each strategic raw material (SRM) should come from recycling by 2030 is not just another environmental target. It rewires how demand planners, procurement desks and asset‑level engineers have to think about end‑of‑life flows for magnets, batteries, and other SRM‑rich components. The regulation translates supply‑security anxiety into legally monitored benchmarks, and that is what makes it structurally different from previous, largely voluntary recycling ambitions.

    Key points at a glance

    • The CRMA, adopted on 18 March 2024, sets a binding benchmark that by 2030 at least 15% of EU annual consumption of each strategic raw material should be met by domestic recycling capacity, as part of the wider “10‑15‑40” rule.
    • This sits against current EU recycling rates for most SRMs that remain well below 1%, particularly for permanent magnet rare earths and several battery metals, implying an order‑of‑magnitude scale‑up in a short timeframe.
    • Digital product passports, permitting fast‑tracks for “Strategic Projects”, and a cap that limits reliance on any single third country to 65% of supply are the main regulatory levers linking recycling to supply‑security objectives.
    • Direct recycling of permanent magnets and bioleaching of battery “black mass” emerge in the material provided as the two most prominent technology pathways, with reported high recovery and energy‑saving potential but significant scaling constraints.
    • If implemented as written, the CRMA is likely to reconfigure sourcing strategies for EV, wind and defence value chains, though the degree of change will depend on project execution, collection logistics, and how strictly member states enforce penalties and monitoring.

    FACTS: Regulatory framework, scope and current baseline

    CRMA scope and the 10‑15‑40 rule

    The Critical Raw Materials Act is an EU regulation adopted on 18 March 2024. It identifies 34 critical raw materials (CRMs) and within them a subset of 17 strategic raw materials (SRMs) that are considered essential for green, digital and defence applications. This SRM subset includes, among others, lithium, cobalt, nickel, natural graphite, manganese, certain rare earth elements (used in permanent magnets), and several technology metals such as gallium and silicon metal, according to European Commission materials and technical factsheets cited in the source list.

    The CRMA frames three quantitative benchmarks for 2030, often summarised as the “10‑15‑40 rule” for each strategic raw material:

    • At least 10% of EU annual consumption should come from extraction within the EU.
    • At least 40% should be processed (refined or transformed) within the EU.
    • At least 15% should come from recycling within the EU.

    In addition, the CRMA introduces a diversification constraint: no more than 65% of the Union’s annual consumption of any strategic raw material, at any relevant stage of processing, should originate from a single third country. This is explicitly designed to reduce the concentration risk associated with current dependencies, for example on Chinese processing for rare earths and several battery materials, which multiple analyses in the provided material describe as exceeding 90% of global capacity for some steps.

    Some commentaries referenced in the input distinguish between the 15% recycling benchmark that appears in the core CRMA text for strategic raw materials and higher aspirational figures, such as 25% recycling for certain battery materials under other policy tracks. In practice, the 15% benchmark is the key legally monitored figure in the CRMA itself, while higher sector‑specific targets are discussed in parallel initiatives.

    Timeline and implementation instruments

    The CRMA is designed to move from adoption to effective monitoring over the second half of the 2020s. Based on the regulatory calendar outlined in the material provided and Commission communications, relevant milestones include:

    • 2024-2025: Entry into force of the CRMA and preparation of national measures. EU‑level monitoring structures are established, and member states design their national contributions to the benchmarks.
    • Q2 2025: Application of accelerated permitting for “Strategic Projects” in extraction, processing and recycling, with indicative maximum permitting durations (for example, 27 months for certain projects mentioned in the input material). The exact timelines are set out in the CRMA and may vary by project category.
    • 2026-2027: Progressive rollout of digital product passports and related traceability requirements, especially for batteries, large industrial equipment and permanent magnets. Recycled‑content minima for some product categories (such as batteries) begin to apply under adjacent legislation referenced alongside the CRMA.
    • 2027 onwards: Full monitoring of reliance on single third countries against the 65% cap, with the Commission empowered to flag excessive concentration and engage with member states and industry.
    • 2030: Assessment of progress against the 10‑15‑40 benchmarks for each strategic raw material, with the possibility of further measures if gaps remain significant.

    Member states are required to establish penalties for non‑compliance that are “effective, proportionate and dissuasive”. Some secondary sources cited in the input mention potential fines expressed as a percentage of turnover; the CRMA itself leaves the exact levels to be defined at national level, so any specific figure should be treated as an example rather than a harmonised EU‑wide rule.

    Recycling baseline and supply concentration

    Across most SRMs, the current EU recycling baseline is described in the supplied material as “below 1%” of annual consumption. Examples include:

    • Very low recovery of neodymium, dysprosium and other magnet rare earths from end‑of‑life motors and generators, often quoted in the range of tenths of a percent.
    • Early‑stage but still limited recovery of cobalt, nickel and lithium from spent lithium‑ion batteries, with only a small fraction of the end‑of‑life pool processed in dedicated EU facilities to date.

    In parallel, EU consumption of many SRMs remains heavily concentrated on imports. The provided sources reference Chinese processing shares above 90% for several rare earth and battery‑related steps, and note that past export control announcements have triggered abrupt supply concerns and price spikes for elements such as dysprosium and magnet alloys. These episodes have directly shaped board‑level risk perceptions in sectors such as electric vehicles, wind power and defence.

    Key regulatory levers for recycling

    To bridge the gap between the current baseline and the 15% benchmark, the CRMA and associated policy instruments deploy several levers that affect supply‑chain operations:

    Illustrative map of emerging EU recycling hubs for critical raw materials.
    Illustrative map of emerging EU recycling hubs for critical raw materials.
    • Strategic Projects status: Recycling projects that qualify as “Strategic Projects” benefit from accelerated permitting, coordination support and increased visibility in EU monitoring. Criteria include contribution to CRMA benchmarks, technical feasibility and environmental performance.
    • Digital product passports (DPPs): Phased‑in DPPs for batteries, large industrial equipment and other SRM‑containing products are intended to record composition, origin, and end‑of‑life instructions. This creates a data backbone for identifying and routing SRM‑rich waste streams.
    • Waste and collection measures: The CRMA dovetails with waste and product legislation that sets collection obligations for electrical and electronic equipment and batteries. Several sources highlight that current collection rates for SRM‑containing products are well below potential, making this a critical constraint.
    • Trade and transport rules: Basel Convention rules and their EU implementation affect cross‑border shipment of hazardous waste such as battery “black mass”. The input material notes that restrictions on exporting such materials outside the EU increase the relevance of local and regional recycling hubs.
    • Recycled‑content and recyclability requirements: Related EU measures, especially for batteries and possibly for magnets, introduce minimum recycled‑content percentages and design‑for‑recycling criteria. While not all of these sit inside the CRMA text, they interact with the 15% benchmark by shaping demand for secondary materials.

    Technology focus: direct magnet recycling and bioleaching

    The material provided highlights two technical pathways as particularly impactful for meeting the recycling benchmark: direct recycling of permanent magnets and bioleaching of battery materials.

    Direct magnet recycling targets neodymium‑iron‑boron (NdFeB) and similar magnets used in EV motors, wind turbines and defence actuators. Instead of shredding whole components and recovering elements via high‑temperature routes, direct processes disassemble magnets and reprocess them more selectively (for example through hydrogen‑based decrepitation or controlled delamination). Reported benefits in the source material include energy savings on the order of 90% relative to primary production and very high material recovery rates when magnets can be accessed intact.

    Bioleaching applies specialised microorganisms and controlled chemical environments to dissolve metals from finely shredded battery materials (“black mass”). Laboratory and pilot‑scale results cited in the input point to recovery rates above 95% for cobalt, nickel and sometimes lithium, with claims of lower capital intensity compared with conventional hydrometallurgy. Several EU projects combine hydrometallurgical stages with bioleaching as an optimisation step.

    Both technology families already feature in industrial pilots and early commercial plants in Europe. However, the performance figures quoted in the material (such as 90% energy savings or specific recovery rates and cost advantages) typically refer to controlled conditions or project‑specific estimates. They provide an indication of potential but do not yet represent a fully mature, standardised industrial benchmark.

    Illustrative project pipeline

    The supplied article lists a set of recycling projects in Europe and associated regions, positioning them against the CRMA recycling objective. Examples include established facilities like Umicore’s Hoboken operations in Belgium, joint ventures such as Veolia-Solvay–Renault battery‑recycling pilots in France, magnet‑focused plants such as those of Urban Mining Company in Belgium, and integrated battery‑materials projects linked to cell manufacturers like Northvolt in Sweden or Hydrovolt in Norway.

    According to the provided material, these projects span a capacity range from pilot‑scale hundreds of tonnes per year up to larger units targeting tens of thousands of tonnes per year of input material, covering both batteries and magnet‑bearing waste. Several rely on hydrometallurgical and bioleaching hybrids; others focus on direct magnet recycling. The article suggests that, if all progressed as planned and reached nameplate capacities, they could collectively cover a substantial share of the recycling volumes implied by the 15% benchmark, at least for certain SRMs. It is important to stress that these figures are scenario‑based and rely on project pipelines that are still evolving.

    INTERPRETATION: Scale‑up challenge, trade‑offs and supply‑chain consequences

    A structural gap between ambition and installed capacity

    From a procurement and supply‑chain planning standpoint, the most striking feature of the CRMA recycling benchmark is the mismatch between current reality and the 2030 objective. Moving from “below 1%” recycling to “at least 15%” within a few years implies not just incremental improvement, but a structural re‑engineering of how SRM‑rich products are designed, collected, disassembled and processed.

    Diagram of the lithium-ion battery recycling and bioleaching value chain.
    Diagram of the lithium-ion battery recycling and bioleaching value chain.

    Past experience with environmental targets suggests that the bottleneck is rarely the chemistry alone. It is the combination of:

    • collection systems that capture only a fraction of end‑of‑life equipment;
    • product designs that embed magnets or batteries deep inside assemblies, making direct access difficult;
    • permitting timelines that lag behind political ambitions; and
    • uncertainty over long‑term feedstock volumes, which complicates financing.

    The CRMA partially addresses permitting through its Strategic Project fast‑tracks and attempts to strengthen collection via traceability and waste measures. However, the real test lies in how quickly industrial actors manage to turn theoretical scrap availability into dependable, contractible flows that can justify multi‑year investments in recycling capacity. In previous cycles, underestimation of this systems‑level complexity has been a recurring blind spot.

    Direct magnet recycling and bioleaching: realistic pillars or over‑concentrated bets?

    The strong focus on direct magnet recycling and bioleaching in many commentaries reflects genuine potential. In internal evaluations of rare earth and battery supply options, processes that promise high recovery with lower energy input stand out immediately-especially when energy prices and emissions constraints are not abstract variables but direct line items on project dashboards.

    At the same time, the deployment history of new metallurgical technologies suggests that reliance on one or two flagship process families can create fragility. Direct magnet recycling, for instance, delivers its best performance when magnets can be separated in relatively intact form. In practice, a significant share of installed motors and generators has not been designed with easy magnet extraction in mind. Without changes in design practices and robust disassembly infrastructure, the accessible magnet pool remains narrower than theoretical availability suggests.

    Similarly, bioleaching’s high recovery figures in pilots still need to be proven consistently at scale, across diverse chemistries, while meeting EU environmental and social standards. Scaling bio‑based processes inside regulated industrial zones raises questions about process control, waste streams and community acceptance. In several industrial audits, enthusiasm for laboratory results has historically run ahead of clarity on large‑scale integration and operating cost variability.

    If direct recycling and bioleaching deliver at the upper end of the performance ranges cited in the material, they can credibly anchor a substantial portion of the 15% benchmark, particularly for magnet rare earths and battery metals. If their rollout is slower or more constrained, the system will have to lean more heavily on incremental improvements in conventional pyrometallurgy and hydrometallurgy, plus design changes that reduce SRM intensity per unit of output.

    Logistics, Basel rules and the geography of recycling

    Geography emerges as a decisive variable once Basel Convention constraints and domestic waste rules are taken seriously. The input material notes how restrictions on exporting hazardous intermediates such as battery black mass outside the EU steer the system towards more localised or intra‑EU recycling hubs. This aligns with the CRMA’s desire for domestic capacity but has concrete operational consequences: feedstock catchment areas, rail and road capacity for scrap flows, and local permitting all become critical path items.

    From a risk‑management perspective, over‑reliance on a small number of very large hubs can be as problematic as dependence on one foreign refiner. Several past incidents-ranging from unplanned maintenance at smelters to local opposition to plant expansions-have shown how quickly capacity constraints in a single node can cascade into material availability issues upstream. A more distributed network of recycling sites, closer to manufacturing and end‑of‑life collection points, can mitigate some of that risk but complicates standardisation and oversight.

    Process overview of direct recycling for rare earth permanent magnets.
    Process overview of direct recycling for rare earth permanent magnets.

    Procurement, contracts and the 65% dependency cap

    The CRMA’s 65% cap on reliance on any single third country is likely to drive changes in procurement patterns even before 2030. In practice, many long‑term contracts for SRMs today lean heavily on Chinese refiners or processing steps. If monitoring reveals that a particular material and stage of processing exceeds the 65% threshold, both policy pressure and internal risk frameworks will push for diversification.

    In earlier episodes—such as the 2010 rare earth export restrictions or more recent controls on battery‑related materials—rapid repricing and scramble‑style contract renegotiations have not been abstract events. They have translated into real budget revisions, board scrutiny, and at times the temporary suspension of production plans. The CRMA attempts to pre‑emptively structure diversification rather than leaving it to crisis‑driven reactions, but the transition will still involve difficult trade‑offs between security of supply, technical specifications, and economic terms.

    Recycling enters this picture as both an additional supply source and a compliance vector. Secondary materials produced in the EU naturally score well against the 65% dependency indicator. However, they also bring specification and qualification challenges: ensuring that recycled cobalt, nickel or rare earths consistently meet stringent quality standards for high‑performance batteries, magnets or aerospace alloys is non‑trivial. In several supplier evaluations, the most robust projects have been those that integrated recycling flows tightly with downstream users, reducing interface risk and aligning quality management from the outset.

    Governance lessons: avoiding “spreadsheet circularity”

    One recurrent pitfall in strategic discussions about circularity is what might be called “spreadsheet circularity”: counting theoretical end‑of‑life material volumes as if they were bankable feedstock. In past audits of supply‑security plans, SRM volumes were at times double‑counted across reuse, remanufacturing and recycling; attrition in collection and processing was assumed to be negligible; and permitting and ramp‑up periods were treated as short, deterministic intervals.

    The CRMA’s legally monitored benchmarks cut against this tendency. Because the 15% recycling target is framed in terms of capacity related to actual EU consumption, and because digital product passports and collection obligations expose real‑world flows, the gap between aspirational circularity in models and delivered tonnages becomes harder to obscure. Governance structures that subject recycling assumptions to the same scrutiny as primary supply contracts appear more robust than approaches that park circularity in a separate, less quantitatively disciplined track.

    WHAT TO WATCH: Regulatory and industrial signals

    • Delegated and implementing acts under the CRMA: Details on Strategic Project criteria, reporting formats, and how the 15% benchmark will be measured in practice (capacity, actual output, or a combination) will materially shape compliance pathways.
    • Digital product passport standards: The scope and granularity of data required for batteries, magnets and large equipment will determine how visible SRM flows become and how easily recyclers can plan around future scrap availability.
    • Member‑state penalty regimes: The level and structure of sanctions for non‑compliance, once adopted nationally, will signal how much regulatory risk attaches to underperformance on recycling and diversification benchmarks.
    • Final investment decisions (FIDs) for major recycling projects: Announcements on capacity, technology choice and offtake arrangements for key plants in Belgium, France, Germany, the Nordics and neighbouring regions will indicate whether the projected recycling pipeline is materialising.
    • Chinese and other third‑country export control measures: New controls on rare earths, battery materials or magnet technologies could accelerate the perceived urgency of CRMA implementation or, conversely, prompt attempts to carve out exemptions.
    • Collection rate trends for batteries and e‑waste: Actual uplift in collection of SRM‑rich products by 2026–2028 will be a decisive leading indicator of whether the 15% benchmark is technically attainable without over‑reliance on process scrap.
    • Design changes in EV, wind and industrial equipment platforms: Moves towards magnets that are easier to extract, battery pack architectures optimised for disassembly, and material substitution will all influence the recycling potential embedded in future end‑of‑life cohorts.

    Note on the methodology TI22 – This briefing combines systematic monitoring of EU regulatory texts and guidance (including the CRMA and related waste and product legislation), review of industry and analyst commentary on recycling projects and technologies, and analysis of how specific SRMs are embedded in end‑use applications such as EVs, wind turbines and defence systems. The focus is on mapping where regulatory requirements intersect with technical feasibility and observed project pipelines, rather than on forecasting prices or prescribing specific commercial arrangements.

    Conclusion

    The CRMA’s 15% recycling benchmark for strategic raw materials converts long‑standing concerns about SRM dependency into a concrete operational mandate. It forces a reframing of recycling from a peripheral sustainability topic into a core pillar of supply‑security planning, on a timeline that is tight relative to current collection systems, permitting practices and technology maturity.

    Whether this benchmark ultimately “changes everything” in SRM markets depends less on the chemistry of direct magnet recycling or bioleaching, and more on mundane but decisive factors: how quickly projects obtain permits, how effectively end‑of‑life products are captured and disassembled, and how consistently secondary materials meet demanding technical specifications. The regulation creates strong signals, but the path from text to tonnage remains contingent on execution.

    For boards, procurement teams and engineers used to managing SRM risk primarily through global contracting with a small set of processors, the emerging landscape is measurably more complex but also potentially more resilient if recycling capacity embeds itself credibly into the supply stack. Maintaining active surveillance of weak regulatory and industrial signals – from delegated CRMA acts to project‑level announcements and collection data – will be essential to understand how the balance between primary and secondary SRM supply is actually shifting.

    Sources

  • Graphite: The Quiet 99% Anode Chokepoint Reshaping Western EV Supply Chains


    Executive summary: Graphite is the least visible but most structurally fragile node in the EV battery chain: up to 99% of anode volume, with more than 90% of spherical graphite capacity concentrated in China and less than 5% of global active anode material capacity outside China. Recent Chinese export controls, emerging Foreign Entity of Concern (FEOC) rules and qualification setbacks at flagship Western projects such as Syrah’s Vidalia plant demonstrate that the constraint is now midstream process control, permitting and geopolitics as much as geology. Mapping 12 strategically critical projects across North America, Africa and emerging hubs in the Andes and Arctic shows a narrow 2024–2028 window in which a handful of technically complex plants will determine whether Western supply chains gain a resilient graphite base or remain exposed to a single midstream jurisdiction.

    Key takeaways

    • Graphite (in battery use, referred to here as active anode material or AAM) can represent up to 99% of anode volume by material, but processing—purification, spheronization and coating—is the bottleneck.
    • China dominates midstream processing and spherical-graphite capacity; export quota adjustments and MOFCOM policy shifts since 2023 have tightened external supply.
    • Western policy layers (e.g., the U.S. Inflation Reduction Act and FEOC screening) raise technical and compliance barriers for ex-China projects, putting near-term projects under intense scrutiny.
    • A small cluster of plants (notably Vidalia) will determine whether allied EV chains can secure qualified AAM capacity by the mid-decade.

    Graphite: the supply-side paradox

    Graphite’s geological abundance masks a classic single-point failure in the value chain. Mining and flake production have diversified geographically at the margins, but the conversion of flake to battery-grade coated spherical graphite—the active anode material (AAM)—is highly technical and remains heavily concentrated in China. The Ministry of Commerce of the People’s Republic of China (MOFCOM) has tightened export controls on certain graphite products in recent years; those measures, together with quota adjustments introduced from January 2025, have reduced licensed battery-grade exports and lengthened lead times for buyers outside China, according to industry reporting.

    What battery‑grade graphite entails

    Battery-grade AAM is not a commodity lump: it requires a sequence of narrow, high-control operations. At first use in this piece, we define FEOC as Foreign Entity of Concern—policy measures that restrict engagement with suppliers, technology or ownership structures linked to certain jurisdictions. Other policy levers referenced here include the U.S. Inflation Reduction Act (IRA) and the EU’s Carbon Border Adjustment Mechanism (CBAM), which add content and carbon-intensity constraints to subsidy eligibility.

    From ore to flake concentrate

    Most natural graphite origins are open-pit or underground operations extracting graphitic schist or gneiss. Ore is crushed and floated to produce flake concentrates typically in the 94–97% total graphitic carbon (Cg) range. Flake-size distribution matters: superfine feedstocks are better suited to spheroidization for EV anodes, while jumbo flakes are valuable in refractories but require additional processing to become AAM. Several non-Chinese projects now produce concentrates designed with battery markets in mind, but producing concentrate is only one link in a longer chain.

    Purification, spheronization and coating

    Transforming flake concentrate into EV-grade AAM exposes the chokepoint. Typical EV anodes demand carbon purities above 99.9%–99.95%, controlled particle-size distributions (often sub-15 micron target sizes in some cell designs), and extremely low metallic and sulfur impurities. Achieving those parameters involves highly coupled unit operations: chemical or thermal purification (acid leach or high-temperature graphitization), jet milling and spheronization to create spherical particles, and surface treatment/coating to tailor first-cycle loss and long-term SEI behaviour. Each stage drives capital and operating costs—reactor design, acid recovery, energy needs and waste treatment are all gating factors—and small deviations in process control can cause product disqualification at cell manufacturers.

    The qualification difficulties at large Western demonstration plants underline this risk. Producing laboratory-scale material is a different engineering problem from delivering consistent, commercial-quality AAM at throughput. Qualification failures typically trace back to coupled issues such as impurity removal efficiency, particle-size distribution control and electrochemical stability—parameters that are sensitive to reactor residence times, acid recovery and neutralization protocols, milling energy regimes and coating uniformity.

    Natural, synthetic and hybrid routes

    Natural graphite routes can offer lower embedded emissions compared with synthetic graphite (the latter derives from petroleum or needle coke and requires energy‑intensive high‑temperature graphitization). Synthetic routes do, however, provide highly predictable purity and morphology, which is why some high-performance cells have relied on them. Hybrid flowsheets—combining natural and synthetic processing stages—are being trialled by Western developers to hedge feedstock and qualification risk, but they add complexity to process control and qualification pathways.

    China’s midstream dominance and the policy shock

    Multiple industry trackers show that a large share of global spherical-graphite and purification capacity is located in China. As a result, mine-level diversification often funnels concentrates back to China for the highest‑value transformation steps. Since late 2023, export management changes and quota tightening by MOFCOM have reduced available licensed exports of battery-grade graphite, pushing spot prices higher and extending order-to-delivery timelines for buyers reliant on Chinese coated spherical graphite. That shock has come concurrently with Western policy incentives that penalize supply chains with links to FEOC jurisdictions or that fail to meet domestic-content rules—raising the bar for ex‑China projects to win offtakes and subsidies.

    Near‑term strategic projects: why a few plants matter

    A small set of projects—selected for their strategic location, feedstock security and claimed processing capabilities—sits at the intersection of supply deficit, qualification risk and policy scrutiny. If these plants fail to qualify material or to ramp reliably, allied EV supply chains will face constrained AAM access and extended reliance on Chinese midstream capacity.

    Syrah Resources’ Vidalia AAM facility (Louisiana, USA)

    Vidalia is the flagship Western attempt to build a vertically integrated, large‑scale AAM producer. Phase 1 is designed for roughly 11,250 tonnes per year of AAM with a planned ramp to higher nameplate levels, and an offtake arrangement with an EV OEM is part of the commercial underpinning. Feedstock from the Balama mine in Mozambique gives Syrah an end‑to‑end supply chain in principle. But in practice, the plant has faced repeated challenges meeting EV‑grade electrochemical and purity specifications on a consistent basis, prompting successive cure periods under the supply contract and extensions while technical and financing discussions continue with stakeholders and the U.S. Department of Energy. These developments illustrate the dual technical and commercial risk of converting flake into qualified AAM at scale in a Western jurisdiction.

    Implications for market participants

    Procurers, OEMs and policy designers should treat AAM as a midstream risk more than a raw-material one. Near-term resilience depends on: (1) accelerating robust qualification pipelines and independent electrochemical testing; (2) prioritizing projects that demonstrate repeatable process control and waste‑management systems; and (3) designing subsidy and offtake terms that recognise extended commissioning and qualification timelines without distorting incentives for rigorous process development.

    Conclusion

    Graphite is a strategic chokepoint because the midstream, not the mine, concentrates technical risk and geopolitical leverage. The 2024–2028 horizon is decisive: a small number of technically complex plants will determine whether Western EV chains can secure trusted, qualified AAM capacity. Market actors should align procurement, technical qualification and policy engagement to avoid a midstream single‑point failure repeating across the EV value chain.

    Sources

  • Technology Metals, Rare Earths, and Precious Metals: A 2026 Strategic Guide

    Technology Metals, Rare Earths, and Precious Metals: A 2026 Strategic Guide

    In 2025, margins, timelines, and sustainability targets hinge on grams of the right metals in the right place at the right time. This guide translates technology metals, rare earths, and precious metals into business decisions: how to reduce supply risk, control costs, and build resilience. We distill what’s changed in the market (from China’s export controls to EU/US policy shifts and battery chemistry changes) and lay out a pragmatic playbook-materials intelligence, supply diversification, design substitution, and circularity-to turn a potential bottleneck into a competitive advantage.

    Technology Metals, Rare Earths, and Precious Metals: What They Are-and How to Turn Them into Advantage in 2026

    For business and IT leaders: a few grams of the right metal can determine product performance, cost, and delivery dates. This means for your business: your EV roadmap, turbine uptime, data center efficiency, or defense contract can hinge on materials you’ve never had to manage directly. Below, we translate complex chemistry into practical strategy: clear definitions, current market dynamics, and an action plan to protect margins and accelerate innovation.

    1) The Business Challenge

    Companies face three pressures at once: volatile prices for battery and magnet inputs, concentrated supply chains (often in a single region), and rising compliance expectations (due diligence, recycled content, digital product passports). The real cost isn’t the technology—it’s idle production lines, missed launch windows, and margin erosion when a single input (e.g., NdFeB magnets or lithium salts) becomes a bottleneck.

    2) Why Traditional Approaches Fall Short

    • Commodity mindset for non-commodity inputs: Treating neodymium, dysprosium, gallium, or cobalt like generic steel or copper ignores scarcity, ESG scrutiny, and geopolitics.
    • Single-source or single-region exposure: Just-in-time and price-first sourcing amplifies risk when export licenses change or a refinery has a disruption.
    • Limited materials visibility in IT systems: ERP/PLM often lack gram-level material traceability across complex BOMs, hindering fast scenario planning.
    • Slow design cycles: Engineering decisions lock in metal dependencies for years, leaving procurement to “solve” structural risk late in the cycle.

    3) The Modern Solution: A Critical Materials Operating System

    What we’ve learned from 50+ implementations is that resilience comes from a coordinated system across Procurement, Engineering, and IT. Here’s what actually moves the needle:

    • Materials intelligence at the BOM level: Build a live register of critical metals (e.g., Li, Co, Ni, Nd, Dy, Ga, In, Au, Ag, Pt) by product and supplier, expressed in grams and cost share. Feed it with price indices and lead-time data.
    • Supply diversification and offtakes: Qualify multiple sources/refiners and regions; use offtake agreements for stability on Li/Co/Ni; pre-approve magnet vendors using grain boundary diffusion to lower dysprosium content.
    • Design substitution roadmaps: Expand use of LFP or LMFP cells for suitable platforms to reduce nickel/cobalt exposure; evaluate rare-earth-light or rare-earth-free motors where performance allows; maximize precious metal thrift (e.g., Au plating optimization).
    • Circularity and recovery: Launch take-back and recycling partnerships; leading processes can recover up to ~95% of key metals from Li‑ion batteries in optimal conditions, improving security of supply and ESG performance.
    • Risk management and policy alignment: Hedge selectively, add escalation clauses, and align with the EU Critical Raw Materials Act and US guidance for clean-vehicle credits to protect incentives and access to markets.

    IT enablers: integrate PLM/ERP with a materials data layer, supplier due-diligence platforms (e.g., for cobalt/3TG traceability), digital product passports (EU), and automated market feeds for scenario planning.

    [BUSINESS_IMPACT]
    Typical Results: 10-20% reduction in cost volatility exposure | 30-50% reduction in lead-time risk on critical parts | 2-4 pts gross margin protection on affected SKUs
    Implementation Time: 90 days for a materials risk map; 6–12 months for dual-sourcing/offtakes; 12–18 months for recycling pilots
    ROI Timeline: Early wins in 1–2 quarters; full payback typically within 12 months on priority product lines
    [/BUSINESS_IMPACT]

    4) Definitions in Plain English (and Why They Matter)

    Technology (Critical) Metals: Metals essential for high-performance technologies—often hard to substitute, recycle, or source reliably. Examples: neodymium and dysprosium (for powerful permanent magnets), gallium and indium (semiconductors, displays), lithium and cobalt (batteries).

    Rare Earths: A family of 17 elements with unique magnetic, optical, and catalytic properties. They’re not always geologically “rare,” but they’re difficult and energy-intensive to process. Indispensable for high‑power-density motors, wind turbines, lasers, and specialized electronics.

    Precious Metals: Gold, silver, platinum (and related PGMs). Historically a store of value, but also crucial in industry—gold and silver for reliable electrical connections and photovoltaics; platinum as a catalyst in automotive and chemical processes. They carry both financial and industrial importance.

    5) Where These Metals Show Up in Your Products

    • Electric Vehicles (EVs): Lithium and cobalt in Li‑ion batteries; nickel for high‑energy chemistries; neodymium and dysprosium in permanent-magnet motors for power density and efficiency.
    • Wind Turbines: Direct-drive generators often rely on rare-earth magnets (NdFeB). They allow compact, efficient designs with fewer moving parts.
    • Electronics: Gallium and indium in semiconductors and displays; gold and silver in connectors and PCBs; cobalt in rechargeable batteries.
    • Defense & Aerospace: Cobalt-based superalloys in turbine blades; rare earths in guidance, radar, and communication systems; precious metals in mission‑critical electronics.

    6) What’s Changed Lately: 2025 Market and Policy Signals

    • Policy tailwinds in the EU and US: The EU Critical Raw Materials Act (2024) sets targets to build domestic capacity (including goals for extraction, processing, and recycling by 2030) and accelerate permitting. The US IRA/CHIPS policies continue to favor domestic or allied-sourced battery materials for incentives.
    • Export controls and licensing: China’s export licensing for gallium, germanium, and certain graphite forms has introduced new lead-time and compliance risks since 2023, with ripple effects continuing into 2025.
    • Battery chemistry mix is shifting: LFP and LMFP have grown rapidly for mass‑market EVs and storage, reducing reliance on nickel and cobalt. Sodium‑ion deployments are emerging for entry EVs and stationary storage, offering cost stability at the expense of energy density.
    • Magnet innovation lowers dysprosium: Grain boundary diffusion and other advances materially reduce heavy rare‑earth content in NdFeB magnets, cutting cost and supply risk while maintaining high-temperature performance.
    • Price volatility persists: Lithium, nickel, and cobalt saw sharp swings since their 2022 peaks, with oversupply in some streams (e.g., nickel laterites) pressuring prices, while rare earths remain sensitive to policy and demand cycles.
    • Circularity is maturing: Industrial-scale recyclers report high recovery rates for battery metals under optimized conditions; OEMs are piloting magnet‑to‑magnet rare‑earth recovery and expanding take‑back programs to meet new regulatory and customer expectations.

    7) Real Impact: What Companies Like Yours Typically See

    In our experience with similar companies, the wins come from design choices, supplier strategy, and IT-enabled transparency. Three anonymized examples:

    Periodic Table of the Elements neon
    • EV portfolio mix: A global automaker introduced LFP packs for two high-volume models, reducing exposure to nickel and cobalt. Result: ~15–20% battery cost reduction on those trims, improved supply optionality, and preserved incentives eligibility in key markets.
    • Magnet redesign: An industrial drive manufacturer adopted NdFeB magnets produced with grain boundary diffusion, cutting dysprosium content by ~70–90% depending on grade. Result: 12% magnet cost reduction, 8-week lead-time improvement, and reduced single‑region dependency.
    • Precious metal thrift and recovery: A hardware maker optimized gold plating thickness and launched an in‑house take‑back program tied to an external refiner. Result: 40% reduction in virgin gold use for selected SKUs and a net-positive material recovery stream.

    Companies like yours typically see faster RFQ cycles, stronger negotiating leverage, and a measurable reduction in COGS variance once materials intelligence is embedded into the product lifecycle.

    8) Quick Reference: How to Tell These Metal Categories Apart

    • Main use: Precious metals = finance + high-reliability electronics and catalysis; Technology metals = enabling components for batteries, motors, and chips; Rare earths = specialized properties for magnets and optics.
    • Supply risk: Precious metals are globally traded with deep markets; technology metals and rare earths often have concentrated processing, higher substitution barriers, and more pronounced geopolitical risk.
    • Price drivers: Precious metals respond to macro/financial signals; technology metals track tech adoption curves (EVs, wind, chips) and policy; rare earths are highly sensitive to processing bottlenecks and export policies.

    [KEY_CONSIDERATIONS]
    ✓ Tie materials exposure to product P&L and roadmap milestones to focus effort where it pays back fastest
    ✓ Use design to de-risk (chemistry mix, magnet strategy) before relying on hedging
    ✓ Build multi-region supply and recycling partnerships to satisfy policy requirements and incentives
    ⚠ Trade-off: substitutions may trade energy density, size, or performance—validate with customer use cases and TCO modeling
    [/KEY_CONSIDERATIONS]

    9) Your Path Forward (No-Nonsense Plan)

    • Days 0–30: Map and measure. Extract a materials BOM for your top 10 SKUs. Quantify grams, cost share, suppliers, and regions for Li, Co, Ni, Nd, Dy, Ga, In, Au, Ag, Pt. Stand up a lightweight dashboard pulling market prices and lead times.
    • Days 31–90: Mitigate fast. Prioritize 3–5 interventions: dual-source a magnet grade; lock an offtake for lithium salts; pilot LFP/LMFP in one platform; reduce gold usage via plating optimization; initiate a take‑back pilot with a recycler.
    • Months 4–12: Institutionalize. Add materials gates to NPI; integrate supplier due diligence (OECD-aligned) and digital product passport prep; include price-escalation clauses; implement inventory buffers where interruption risk is highest.
    • Months 12–24: Scale and differentiate. Expand recycling contracts; negotiate multi-year supply aligned with growth; co-develop substitution R&D with key vendors; communicate verified progress in sustainability reports and customer bids.

    10) Frequently Asked Questions

    Are rare earths truly “rare”? Not always geologically rare, but complex to separate and refine. Processing is capital-intensive, creating supply concentration risks.

    Can we avoid cobalt and nickel in EVs? For many segments, yes—LFP/LMFP reduces or removes nickel and cobalt. For long-range or performance vehicles, high‑nickel chemistries still dominate; a mixed portfolio is common.

    Is recycling a near-term supply solution? It’s growing quickly and already yields high recovery rates for some streams, but it won’t replace mining near term. It does reduce risk, improves ESG metrics, and increasingly supports compliance and incentives.

    What’s the role of IT? Connect PLM/ERP to a materials layer, automate supplier attestations and chain-of-custody data, and run scenario models that translate price/lead-time shocks into COGS and delivery impacts per SKU.

    Summary for Decision-Makers

    In our experience with similar companies, the combination of materials intelligence, diversified supply, smart design choices, and circularity delivers the fastest, most durable ROI. The opportunity isn’t just risk reduction—it’s faster launches, stronger eligibility for incentives, and a more credible sustainability story in competitive bids.

    If you want a quick benchmark, we can deliver a 3-week materials exposure scan across your top SKUs and supply base, then co-prioritize two high-impact interventions for the next quarter.

    Further Reading